
Optimal Token Usage with Claude Code
Everyone complains about getting blocked, many of them on the expensive plan. I work differently. Here are the numbers, and the method behind them.
I was at a conference about working with Claude through GCP. Again and again, from speakers and peers alike, I heard the same complaint: everyone hits the usage limit frequently, and many of them pay for the most expensive plan, Max 20x ($200 a month).
I build and maintain two complete systems in parallel, on a Max 5x plan ($100 a month), and I barely run into the limit. I had always assumed I was a heavy user, but the complaints at the conference shook that assumption: if everyone gets blocked (even on a pricier plan) and only I don’t, maybe I am actually a relatively light user?
So I sat down and looked at the numbers, and it turned out the opposite was true.
Full disclosure: The token and model figures were extracted from Claude Code’s local transcript files. The output figures, such as commits, lines, and assets, were measured from git history and the file system.
Layer 1: The throughput the data revealed
A single month of work adds up to a volume that looks more like an automated system or an entire team than a single developer at a keyboard:
| Metric | Value |
|---|---|
| Total tokens processed | 8.83 billion |
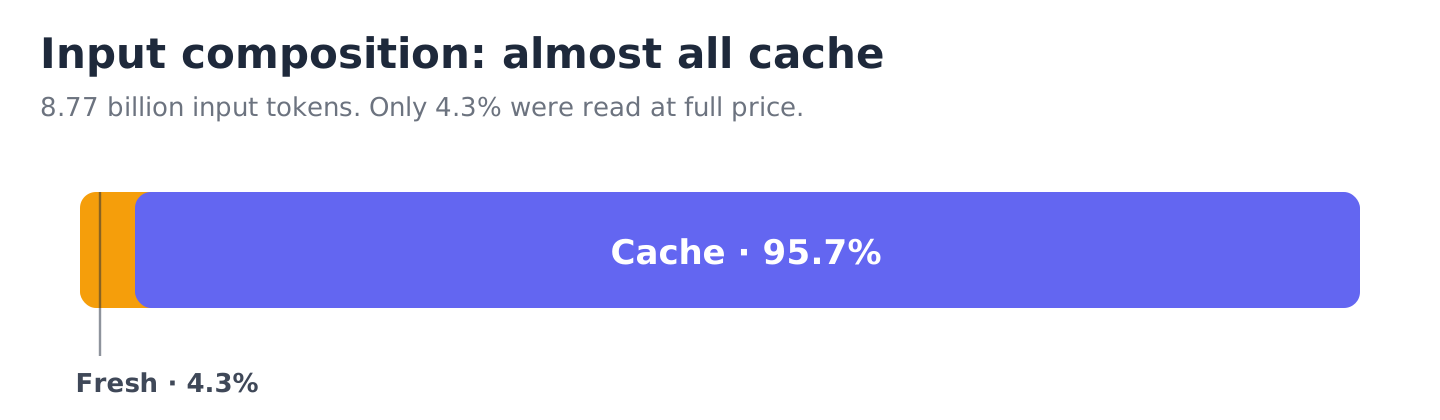
| Of those, served from cache | 95.7% |
| Cache leverage | ×6.7 |
| Plan | Claude Max 5x ($100/month) |
| Times I hit the limit this month | A single case (an experiment with Fable, an expensive model, twice as wasteful as Opus) |
The 8.83 billion is the total number of tokens processed, but the overwhelming majority of them came from cache, ready to use, without being reprocessed. In terms of actual processing, that is equivalent to just 1.31 billion fresh tokens (tokens that go through full processing, not from cache), a leverage of 6.7x. We will expand on the mechanism later.
This throughput is the result of a lot of high-intensity work across parallel channels:
| Metric | Value |
|---|---|
| Active working hours in the month | ~138 |
| Average rate per working hour | 64 million tokens |
| Peak hour | 196 million |
| Busiest 5-hour window | 496 million |
| Concurrent conversations (routine) | 2 to 3 |
| Peak concurrent conversations | 5 |
A note on the parallelism: Anthropic publishes an official figure in the Claude Code documentation. Average enterprise consumption is around $13 per developer per active working day, and $150 to $250 per developer per month. 90% of users stay under $30 per active day. Converting that roughly to tokens (my conversion, since the official figure is given in dollars) comes to about 300 to 600 million tokens a month. That is a strong, reliable reference point. What Anthropic does not publish is an official average consumption per plan (Max 5x vs 20x); there, the comparison relies on public reports in wide ranges. Even against those, this does not look like light usage:
| Reference point | Tokens per month | Ratio here |
|---|---|---|
| Typical enterprise developer (official Anthropic figure) | 300 to 600 million | 15x to 30x |
| Heavy Max 20x user (30-day experiment) | 1.2 to 1.5 billion | 6x to 7x |
| The most extreme documented user (Opus) | 4.5 to 6 billion | 1.5x to 2x |
This is usage at the high end of what is publicly documented. It sits above everyone except the single heaviest user on record, who constantly exceeds the limit on a larger plan. And yet, I almost never collide with the limit. It seems that it is not just the amount of work that matters, but the ways in which it is done. The next layer is devoted to exactly that.
Layer 2: The mechanism, and why it does not get blocked
This gap is possible thanks to several levers that work together. Briefly, and with the data proving that each one was actually engaged:
Caching. 95.7% of the input was served from cache. To understand why this is critical, you need to know how a conversation with the model works: every request resends the entire accumulated context history. That means the system instructions, the tool definitions, and every previous turn of the conversation. Reprocessing all of that history on every round is the expensive part.
Caching solves exactly this: the context stored in it is not processed from scratch each time, but served ready-made, and far cheaper. Only the new addition, the latest message, goes through full processing. That is how 8.83 billion processed tokens shrink to the equivalent of 1.31 billion fresh ones. And this is not a pricing trick, but an official Anthropic mechanism.
Differential model routing. Not every task needs the expensive model. 54.6% of tasks already run outside Opus. The smallest and cheapest model, Haiku, performed 6,757 mechanical scans on its own, meaning the cheap, boring work was pushed out of the powerful model.
Sub-agents that return distilled output. 714 sub-agent invocations processed 1.2 billion input tokens and returned only 0.4% of that to the main conversation. And here the big saving is actually on the input, not the output: the heavy work (reading files, running searches, exploring dead ends) happens inside the sub-agent’s context and never enters the main conversation. That keeps the main conversation lean, and remember that its context history is paid for again on every round. The sub-agent returns only a distilled summary, so the main context does not swell, is not reprocessed over and over, and never reaches the overflow that forces compaction and loss of information.
Proof from a real window. The screenshot below is of a high-throughput 5-hour window, moments before it reset:
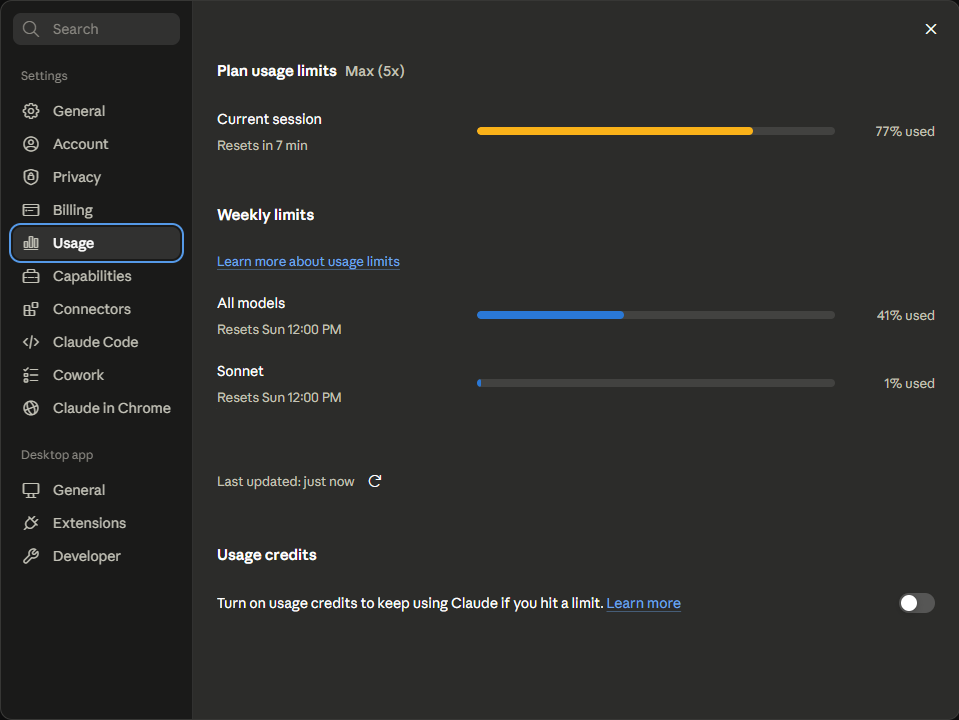
This was not a quiet window. Over 300 million tokens were processed within it. 96.7% of them were from cache, with two hours that each exceeded 100 million. And here is a point that can mislead: those two heavy hours were characterized by running local models, scripts, and tests.
If all of those run outside Claude, why are these the heaviest hours by token count? The answer: the content generation itself did indeed run on the local machine at zero tokens. But to orchestrate dozens of model runs and scripts in an hour, Claude Code performs many command-and-monitor rounds. Each round carries the hot context from cache with it. In other words, the high number is mostly cheap cache reads from the dense orchestration, not expensive processing.
That actually reinforces the point: even the hours that look “expensive” are mostly cheap cache and work that ran outside the token cycle.
And yet, the counter showed only 77%, with 7 minutes left until the reset. Even under the high throughput documented here, a safe margin from the limit was maintained.
A side note on the number: that same evening, in a later measurement as the time window closed, the monthly running total had already crossed 9 billion tokens. That number did not go through a full composition analysis like the 8.83 billion, so it remains only a mention and does not enter the main statistics. The canonical anchor throughout this article is 8.83 billion, the conservative and analyzed one.
Across the whole month I found one hit against the 5-hour window limit, on the day I tried the new Fable model, which hallucinated and was twice as wasteful as Opus. Beyond that single case, I was not blocked. Hitting this limit is very rare for me, a handful of times in half a year.
The notable case was when Anthropic changed the pricing model and cut both the token window per session and the session’s length. A quick adjustment to my agent team’s working rules restored a continuous workflow. That too is evidence that the solution is architectural, and adapts when the rules change.
Layer 3: These are not tokens evaporating, this is output
Token volume can be noise. So what was actually built that month? The following numbers were measured from two independent sources: the git history of the logistics system, accurate to the commit level, and the file system of the game project in development (which is not under git).
| Output | Amount |
|---|---|
| Commits | 86 |
| Lines of code written | ~65,000 |
| Files: changed · created | 680 · 433 |
| Deployments (most to all environments, including production) | 14 |
| New test files | 40 |
| Planning and documentation files | over 90 |
| Graphic art assets (local models) | ~970 |
| Local image-generation runs | 1,242 |
A word on what the numbers say, and do not say. Most of the 65,000 lines are a migration: a rewrite of the backend’s core service, the largest and most central in the system, from Node.js to Rust. It was a process rigorously verified across 165 of 165 compatibility scenarios against the source, and not a line-by-line translation but a reimplementation in a language with a completely different worldview (static types instead of dynamic, explicit ownership-based memory management, and a different concurrency model).
Lines of code is a poor measure of output, so the story is not just the quantity but the variety: in that same month, the same person, the same machine, produced a rewritten and verified backend, a stream of features in a live system, and a second game engine with ~970 art assets and the pipeline that generates them. That is the footprint of a small team, not a single developer.
Output and variety like that simply cannot be achieved through repetition. The high cache rate does not come from chewing on the same thing, but from an architecture that lets you run on a hot context while producing things very different from one another.
Layer 4: Not just more, but better
Suppose you are convinced that I did not repeat myself, and that an enormous amount of code and assets really was created. The question of quality remains: maybe much of that quantity is simply junk?
So I measured quality against public industry data, filtered to only the code I touched that month:
| Metric | Mine | Industry benchmark |
|---|---|---|
| Code rewrite (churn) | 2.32% (product code) | 7.1% in the industry today, 3.3% for a human before the AI era |
| Token noise (waste) | ~10-30% | 40-80% |
| New bugs introduced into the code this month | Zero new logic errors | (the existing errors are old debt) |
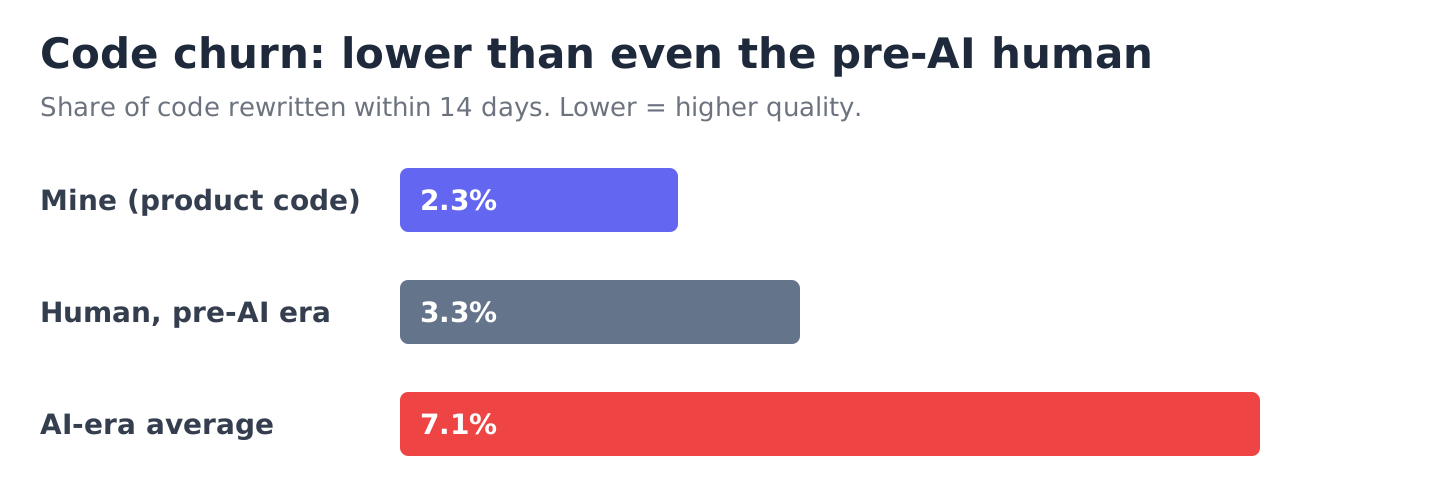
My product code is rewritten at a lower rate than the average human’s from before the AI era, and its token noise is about half the norm. Even the iterative Rust migration (5.01% churn) sits below the AI-era norm. Two independent quality signals point in the same direction: static analysis (eslint+clippy) on this month’s code found zero new logic errors, only style warnings, while all the existing logic errors are years-old debt I did not touch. And a second method, git-blame analysis that checks how many of the lines written this month were later fixed, found a bug rate of ~2.1% in the new code, consistent with the churn.
And why did the code come out both fast and clean? This is the most important point in the article. It did not happen by chance, but because of how the work is ordered: a large module or migration is planned first, thoroughly, in planning files. The Rust migration, for example, rested on a measured planning skeleton of ~17,800 lines and ~190,000 words, plus 165 compatibility scenarios, before a single line of implementation code.
The mechanism is simple: all the hard thinking is done once, up front, against a complete plan, instead of improvising while writing. And then the execution phase comes out both cheap and accurate. Cheap, because the planning files already sit in cache, so execution against them processes almost nothing anew (measured: the planning conversations ran at 84% cache, and the execution conversations against them at 97%). And accurate, because the direction was already decided and checked, so there is less rewriting. One cause, two results: lower cost and higher quality.
To close, in fairness: there is one quality metric I did not check. I did not compare my bug rate to the bug rate of a human programmer on the exact same task, simply because I have no such measurement. So the claim is about every metric that was measured, not every possible metric. But on every metric that was measured, the direction is the same.
Layer 5: What it is worth
Only now, after throughput, output, and quality have been laid out, can this be translated into money without it sounding like throwing numbers around. If that same token processing had run against the API, at the official price list:
| Scenario | Cost (API equivalent) |
|---|---|
| Real models + cache (what actually happened) | ~$18,200 |
| Opus only + cache | ~$24,200 |
| Real models, no cache | ~$106,000 |
| Opus only, no cache | ~$136,000 |
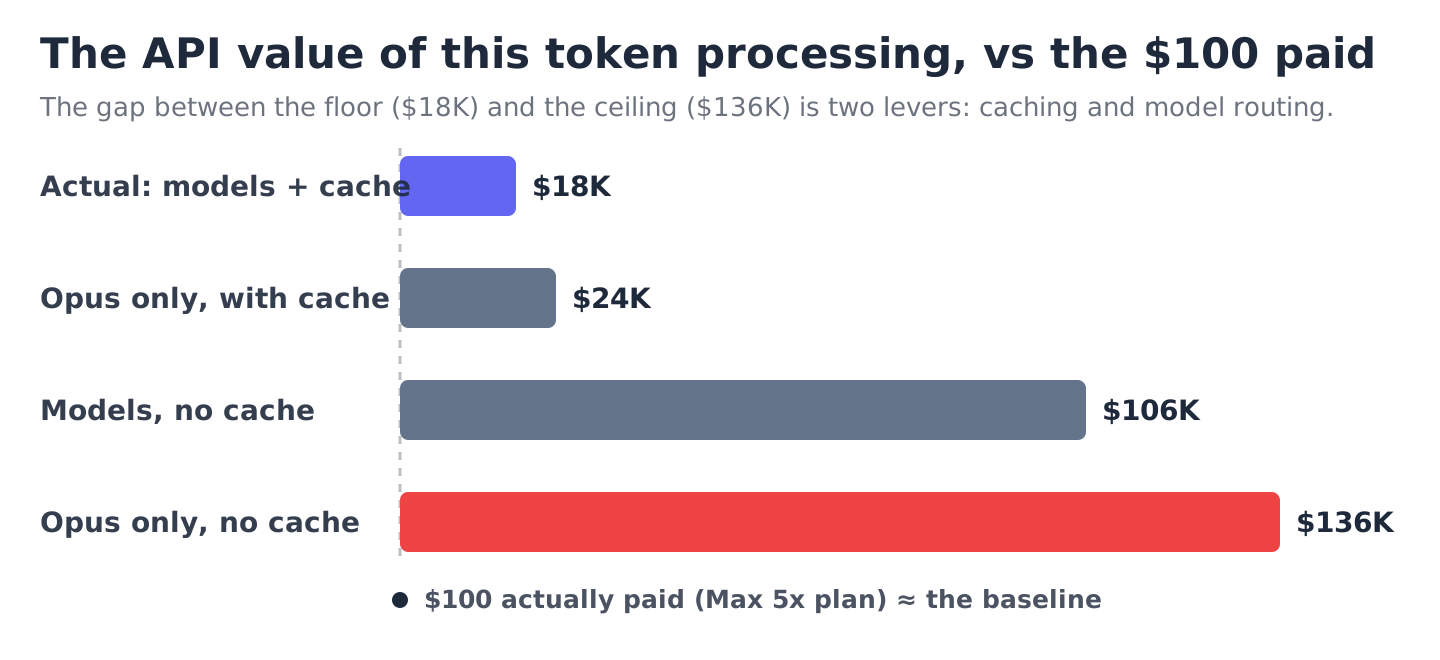
What separates the floor ($18,200) from the ceiling ($136,000) is exactly those two levers: high caching and model routing. The actual processing is 13.4% of the worst-case scenario.
And to be precise: even the $18,200 is not a neutral baseline. It already embodies 95.7% cache and model routing. A user who does not have those, on the same work, does not land on $18,200 but drifts upward into the six-figure scenarios.
And on the limit axis it is even more severe: without the cache, the same volume requires 6.7x the fresh tokens, which blow through the 5-hour window ceiling several times over, so such a user not only pays far more but gets blocked almost immediately. The high throughput on a $100 plan is not a gift from Anthropic, but a reward for work architecture.
It is important to remember what these sums measure: only the API value of the token processing. They do not include all the work done outside the token cycle (as described in the next layer), for example, generating the ~970 assets on local models. Had that same generation run through an output-heavy cloud model, it would have blown the limit immediately; here it consumed zero. So $136,000 is a floor for the total value of the work, not a ceiling.
Layer 6: The method, as principles you can adopt
What makes it possible to work without reaching the limit is not a lower volume of work, but a more efficient work architecture. Each layer lowers the real cost of every round without lowering the amount of work, and most of them can be adopted by any Claude user:
-
A custom agent team that runs itself. Instead of one swelling conversation, you run an agent team tailored to the project and the way of working, one that knows how to take each task to the right agent and delegate to sub-agents on its own. The heavy work (reads, searches, scans) stays outside the main conversation and does not pollute its context.
-
Model routing by task difficulty. Systematically matching the model to the difficulty dramatically lowers the cost, without hurting quality where it is needed. Opus is reserved for what truly needs it, Haiku and Sonnet for the rest.
-
Tools that run work outside the token cycle. A script, test harness, or pipeline is built once and run again and again. The tool performs the batch work itself, and the cost shrinks to the tokens of issuing the command and monitoring the result alone. 47% of the shell commands in the month were invocations of such mechanisms.
-
Delegating generation to local models, orchestrated by Claude Code. Heavy generative work, such as creating graphic assets, runs on local models on your own hardware, entirely outside Claude, at zero tokens. Claude Code keeps the conductor’s role: it writes the workflows, runs them, and manages the whole pipeline as a single process. And beyond the savings, this gives complete, clean ownership of the product, and a multimodal toolbox you can enrich and swap as the field evolves.
-
Planning in Markdown, then executing. As we saw in Layer 4: the expensive effort is invested once in planning files, and then execution against them is cheap and accurate. And you can even write the planning files themselves with Claude Code, but together with the user and according to their precise instructions, so the result is a plan you stand behind, not one imposed on you.
-
Caching and switching conversations in the right proportion. Continuous work keeps the cache hot. The simple rule: stay on the same topic until the context fills up and then switch, but do not stay in one conversation discussing ten different topics.
The common denominator: Claude Code does not just perform work, it manages it. It delegates to sub-agents and external tools, checks what came back, sends it for revision, and makes sure a finished product of good quality is produced. It is the center that orchestrates work, much of which runs outside it.
Summary
The limit everyone runs into is real, but it is not a decree of fate or an impassable barrier. We have enormous influence over where we hit it, if at all. When most of the input is cached, when the heavy work sits in sub-agents and external tools, and when the expensive model is reserved only for what truly needs it, you can process an enormous volume on the cheap plan and still come out with broad, high-quality output.
Each of these layers is a principle you can adopt. The difference between someone who meets the wall and someone who does not: not the plan you pay for, but how you build your workflow.
This is not a question of how much. It is a question of architecture.
Methodology and sources
The usage data (apart from the comparisons) was extracted from Claude Code’s local transcript files, which record the token breakdown and the tool calls for every message. The period: 26/05 to 25/06/2026 (~31 days; Claude Code deletes old transcripts, so this is a representative month). The output data (commits, lines, files) was measured directly from git history. The dollar sums are the equivalent at the official API price list, not an actual charge (a fixed subscription was paid). The tool counts are an estimate (keyword matching), not an exact count.
The comparisons against other users: Anthropic has an official figure, average enterprise consumption (about $13 a day and $150 to $250 a month per developer, 90% under $30 a day; see the first link below), and that is a reliable reference point. Average consumption per plan (Max 5x vs 20x) is not officially published, so the per-plan comparisons rely on public reports in wide ranges. The plan multipliers (Max 5x = 5x Pro, Max 20x = 20x Pro) are official.