GCP Cloud Labs - Lab Six
A guide and lab for running a container application in different environments. How to build a container and how to deploy it on a Kubernetes cluster or Cloud Run service.
Running a Container Application in Different Environments
In this lab you can acquire knowledge and practice the following topics:
-
Working with Docker and creating a container.
-
Artifact Registry.
-
Cloud Run.
-
GKE and Kubernetes.
Introduction:
This lab is a continuation of the previous lab, which demonstrated how to write a Python program and turn it into a Web application. Here as a continuation, we’ll learn to transfer the application to a container and work with it in various cloud environments.
Working with containers is an important process in planning, upgrading, rebuilding, migrating, and the current and efficient routine of applications and services.
Working with containers enables savings and efficiency in resource utilization, great and easy portability between different environments, means, and providers, and easy and swift CI/CD processes.
In this lab I tried to provide an initial approach to container-based environments, and demonstrate how an application wrapped in a container can run in different environments.
Most of the guide teaches how to manage the different environments. Because once the environment exists and is managed and the container is built correctly, running it on the environment is a relatively simple matter.
Working with Docker:
First we’ll want an environment where we can build a container and also test that it works. In Cloud Shell the tools we need like Docker and Git are already installed. But it will be a bit difficult to test the application in that environment. So we’ll set up a micro-size Ubuntu server named docker-test, and during setup mark under Firewall - Allow HTTP traffic.
In addition, under Identity and API access there are Access scopes, where we’ll choose Allow full access to all Cloud APIs. We’ll need this later. Everything else at default.
After the server comes up and is ready, we’ll connect to it using the SSH button and there install the tools.
Installing Docker:
After connecting to the server, we’ll run the following commands:
# Add Docker's official GPG key:

sudo apt-get update

sudo apt-get install ca-certificates curl

sudo install -m 0755 -d /etc/apt/keyrings

sudo curl -fsSL https://download.docker.com/linux/ubuntu/gpg -o /etc/apt/keyrings/docker.asc

sudo chmod a+r /etc/apt/keyrings/docker.asc


# Add the repository to Apt sources:

echo \

  "deb [arch=$(dpkg --print-architecture) signed-by=/etc/apt/keyrings/docker.asc] https://download.docker.com/linux/ubuntu \

  $(. /etc/os-release && echo "$VERSION_CODENAME") stable" | \

  sudo tee /etc/apt/sources.list.d/docker.list > /dev/null

sudo apt-get update

# Install Docker

sudo apt-get install docker-ce docker-ce-cli containerd.io docker-buildx-plugin docker-compose-plugin
Creating a Container:
We’ll create the folder app-files there and then enter it using the command:
mkdir app-files && cd app-filesThen copy the game files (reference to the previous lab) into it from GitHub:
git clone https://github.com/yoson7/Linkedin-Articles.git .The period at the end means we’re downloading the content from the Repository to the location where we currently are.
Now that the files are with us, we’ll create a Dockerfile. This is a file that tells Docker how to build a Container Image.
Dockerfile:
With the command - nano Dockerfile, the text editor will open and there we’ll paste the following content:
FROM nginx

ADD BreakBricks/works/build /usr/share/nginx/html

RUN sed -i 's\root   /usr/share/nginx/html;\root   /usr/share/nginx/html/web;\g' /etc/nginx/conf.d/default.conf

EXPOSE 80
Save and close.
Explaining the Content:
All the following lines build an Image from a certain base. On top of that base we’ll want to add things, change, delete some and edit some. Sometimes we won’t know the folder tree structure of the Image we want to work with. To know what and where to change, we’ll pull the Image and run it as a container. When we connect inside, we can examine the folder tree. That’s how we’ll know where to copy files and which settings need to be edited.
Say we simply want to run the basic nginx Image. Then we’ll connect inside to examine the folder tree and nginx settings inside. We’ll use the following command:
docker run -it nginx bashIn this command we’re telling Docker to run a container. With the -it flags we’re saying we want to connect inside. Then we give it the Image name to activate, and finally what command to run. Since we’re connecting inside, we’ll need a Command Line Shell. So the command is - bash.
Commands in the File:
- FROM - this command opens the Dockerfile and tells Docker where to load a base for the Image we want to build.
Sometimes when we define FROM it won’t be to define a base image, but to set a source for copying files and libraries. Because often the final product is composed of components obtained from several different images.
There are many ready-made Images of all kinds of things that can be downloaded just like that, or pulled in this format in a Dockerfile. When simply specifying a source name, Docker pulls it from its Image repository - Docker Hub. But there are also repositories for Google - GCR, Microsoft - MCR, etc. When you want to pull a container from there, simply put in place of the name, the address of that Image in that repository.
-
ADD - copies the content of a folder in the Build environment into the container being built. In our case the environment is the docker-test server, and we give it a path inside the container to which the content will be copied. Here we’re copying the application files we downloaded from Git into the container being built.
-
RUN - runs a Linux command in the Build environment. In our case this is a command that replaces a string inside a file. The file is the default page settings file of nginx in the container. We’re replacing the default path with the path that will match the application we uploaded there in the previous step.
-
EXPOSE - this command instructs the container to listen on a specific port. Since the container is running an nginx service, it will listen on port 80.
Building the Container:
To build the container based on the configuration written in the Dockerfile, we’ll run the following command:
docker build -t nginx-test .After the build process finishes we’ll run the command:
docker imagesYou can see an Image named nginx-test. To run the container and check that everything is working correctly, enter the following command:
docker run -p 80:80 -d testExplanation:
p maps the port on the machine to the container’s port. The port on the left is the machine’s, and the right one is the container’s.
d stands for detach. That is, instead of activating the container and entering us into some Shell, Docker activates the container so it runs in the background as a service.
Now navigate to the external IP address of the docker-test server on port 80. We should reach the application as we reached it on the nginx server set up in the previous lab. That’s because we linked the active port in the container to port 80 of the server.
Artifact Registry:
This service serves as a library for ready-made packages.
Earlier we talked about Docker, Microsoft, and Google’s container libraries. From there you can pull and run ready-made container Images, or customize and create your own Image. The Image we create will be stored in Artifact Registry. Every time we want to use it in any service that runs containers, the service will use the Image to activate containers and do the work.
The service can also be used to store software packages and operating systems, but we won’t deal with that.
Setting Up a Repository:
We’ll set up a repository and store our Image in it.
In the general menu of the GCP management dashboard you need to click down on More Products, then scroll down to the CI/CD category. Alternatively simply write in the search at the top of the dashboard - Artifact Registry.
The first time you connect, you need to enable the service’s API in that project. After that we’ll go to the service’s page, and we can click CREATE REPOSITORY.
- Name - breakbricks.
- Below you need to mark a format. As we said, you can store software packages and other things there. But we need to store a Docker Container, so that’s what needs to be marked.
- Choose Region - me-west1.
- Under Cleanup policies, mark Delete artifacts, then click ADD CLEANUP POLICY.
- Give the Policy a name - last-3. And according to the name - mark below Keep most recent versions.
- Then a field will open with Keep count written there, where you need to specify how many versions to save. Put the number 3.
- Click CREATE.
Now the repository has been created and we’ll want to see how we can send a container to it.
Uploading a Container to the Repository (push):
-
Click on the repository name to enter.
-
Click Setup instructions at the top.
-
In the panel that pops up on the right, copy the command there.
-
Connect via SSH to the docker-test server where we created the container earlier. Run the command from there. Then a confirmation request will appear to write the settings to a file on the server - click y.
-
We’ll return to the repository in Artifact Registry and see that at the top there’s a path for us. The path is composed of the Hostname of the service in the Region we chose, followed by the project we’re working in and finally the repository we opened. Next to it is a copy button. Copy the path. In my case this is - me-west1-docker.pkg.dev/mobile-app-yosi/breakbricks
-
On the docker-test server we’ll build the container again according to the same Dockerfile. Only now instead of calling it test, we’ll call it by a name that contains the entire path we copied, and finally the container name itself. For example - me-west1-docker.pkg.dev/mobile-app-yosi/breakbricks/breabricks. Enter the folder containing the Dockerfile.
The command will look like this:
docker build -t me-west1-docker.pkg.dev/mobile-app-yosi/breakbricks/breabricks .-
After the container creation process (Build) finishes, enter the docker images command and see the new Image there.
-
Before uploading the Image to the repository, we’ll need permissions. So either attach our account, which is the Owner of the project, to the docker-test server - using the command gcloud auth login, or give permissions to the machine’s account. Give permissions to the machine’s account, which is currently the project’s default account. The command gcloud auth list will show it to us, and we can copy it from the SSH window.
-
In the Artifact Registry window click at the top (in the path) on the project name, or on the left in the menu on Repositories. Now in the repositories view (here in the lab environment there’s only one) mark the checkbox next to breakbricks, and a permission management window will pop up on the right.
-
Click ADD PRINCIPAL, in the panel that opens paste the docker-test server’s account in the New principals row.
-
Click on the Select a role menu, and on the left choose Artifact Registry, then on the right the Role of Artifact Registry Create-on-push Writer.
-
Click SAVE.
-
Now a simple push command will transfer it to the repository. Since we already included the path in its name, the command already knows where to transfer it.
The command will look like this:
docker push me-west1-docker.pkg.dev/mobile-app-yosi/breakbricks/breabricks-
Enter the repository and see an Image named breakbricks there. You can see that versions are managed inside, though currently there is only one version.
-
Click on the version to get a look at the data. What interests us is the Pull tab. There in the middle of the page under Pull by tag there is a command to pull the container. That’s less interesting. What’s interesting is the string with the full address of the container along with the latest tag. Using this string will always give us the latest version of that image. Copy and save it aside for the next step.
Important to remember:
-
Because we’re working with the default account of a VM in the project, if at the docker-test server setup stage we hadn’t opened access to all Cloud APIs, we wouldn’t have been able to make a call to the Artifact Registry API, even though the account has permission on the repository we opened there.
-
Best Practice is to work with a service account we opened with permissions tailored for the work. The account is permitted to call all APIs, but then that API will check its permissions managed through IAM.
Cloud Run:
If we want to run a single container, as a service that is always active or for a scheduled operation, we can use the Cloud Run service. This is a fully managed service for running containers. Thus you pay only for the runtime and the computing resources of the container itself. Additionally, there is no need to manage and maintain servers and a communications system that runs the container environment. Everything is managed. But for that, a container available in the cloud environment is needed, or a Build process that will build a container when needed.
Since in the previous step we already uploaded our container to the cloud environment, we can deploy it as a Web service.
Creating a Service:
-
In the general menu on the left click MORE PRODUCTS and then in the SERVERLESS category click Cloud Run - or write in the search bar at the top.
-
Enable the API.
-
On the Cloud Run page that opens, click CREATE SERVICE at the top.
-
Mark Deploy one revision from an existing container image.
-
In the Container image URL field paste the string of the Image path with the latest tag we copied earlier. It looks like this:
me-west1-docker.pkg.dev/mobile-app-yosi/breakbricks/breakbricks:latest-
Choose region - me-west1.
-
Authentication - choose Allow unauthenticated invocation because we’re opening a public Web service.
-
Now we arrive at the Auto Scaling option. This option is intended to run more containers in parallel if there’s load, and shut them down when the load decreases. So you pay only for what’s needed at that time. Therefore leave the mark on CPU is only allocated during request processing, and choose 0-2 instances.
-
Under Ingress control choose All - again, because we’re publishing a public website.
-
Now there are various settings that mostly we won’t want to touch right now, and some we’ll touch in an advanced lab later. Just configure the port and computing resources: port 80, memory 128MIB, CPU choose 1>. When an additional field opens to know what fraction of a CPU core we want to consume, mark an eighth - 0.125.
-
Because we chose such limited resources, under the Requests field we’ll be required to mark that Maximum concurrent requests per instance is 1. But we don’t need more.
-
Click CREATE at the bottom.
Now the service will deploy the container from the Image with all the settings we configured. This will take a few minutes.
At their conclusion, we’ll receive a URL link at the top of the page to the service we uploaded. Here it’s a lab environment and this is sufficient. In reality we’d want to attach to the service a clear DNS address under our domain, as a CNAME.
Working with GKE:
GKE is the Kubernetes service in Google’s cloud environment - Google Kubernetes Engine. Under this managed service it’s possible to set up and configure Kubernetes clusters, connected to networks, the permissions system (IAM), and other services in Google’s cloud environment.
The GKE service is managed at different levels. That is - in certain configurations fewer things need to/can be configured, and everything runs behind the scenes. This also means more limited maneuvering room for the system administrator, who can choose a configuration where they have higher configuration capability.
In previous labs we referred to various gcloud commands, and everyone who entered the Docs pages of the commands saw the number of options and values (Flags) that can or must be added to the commands. For comparison you can go to the page of the following command:
gcloud container clusters createThere you can see the enormous number of values that can be attached to this command. Teaching you how much you can expand, deepen, and detail GKE cluster settings.
And therefore, even though it’s possible to create a GKE cluster in one short CLI command, here we’ll perform the creation in a complex and settings-rich process. All this is meant to provide understanding of the cluster and its structure.
Preparation:
A GKE cluster is designed to run complex or simple software in a distributed configuration. The goal is to break the software into small services where each one performs a small part. That way if there’s a problem in the process, you can understand relatively quickly which part has the problem and where to fix it. This also enables relatively easy and fast upgrading and updating.
Each such part operates in a unit called a Pod. Such a unit can include one or more active containers that together perform the work required by that service. Almost always a service is deployed in a redundant configuration, and the number of copies of that Pod running in parallel will grow as the load on the service increases. Therefore the term Service - in GKE’s language is also used to describe a gateway that is also a Load Balancer, an IP address that receives traffic on a certain port for the service as a whole. That Load Balancer knows how to forward requests to the various Pods.
Therefore we’ll need an address range for all the various Pods that will run under the cluster, and we’ll need another address range for those Services - those LBs that will receive traffic from outside or from other services in the cluster, and forward it to Pods.
Naturally, the address range for Pods will need to include many more addresses, because each service consumes one address for an LB and several addresses for Pods.
So we’ll create a network in which the cluster will operate, and give it the required ranges.
Networks and Ranges:
- The previous labs explained the process of setting up networks in GCP.
-
Set up a VPC named app, with MTU of 1500, Custom subnets.
-
Main Subnet named main, Region - me-west1, main range - 10.0.1.0/24.
-
Create a secondary Subnet named services, range - 10.0.2.0/24.
-
Create a secondary Subnet named Pods, range - 10.0.4.0/22.
-
Enable Private Google Access and create the network.
- Pay attention to the Pods range. A range with prefix 22 allows about a thousand addresses. Each Pod requires two addresses for replacement and maintenance purposes. Therefore if calculating that we’ll need a cluster of 4 machines each deploying 30 Pods, a range with prefix 24 will suffice. You always need to calculate the available ranges and allocate according to what’s needed, to avoid wasting ranges unnecessarily. But since we’re in a lab environment, and Kubernetes clusters usually contain many more Pods, we’ll allocate a larger range.
Service Account:
- The previous labs explained the process of setting up a service account.
Set up a service account named apps-gke and give it the following Roles:
1. Kubernetes Engine Service Agent
2. Monitoring Viewer
3. Monitoring Metric Writer
4. Logs Viewer
5. Logs Writer
6. Service Account User
Creating a GKE Cluster:
In the main menu click on Kubernetes Engine, enable the API and go to the Clusters page. There click Create at the top to open the process.
The default is creating an Auto Pilot Cluster, which means a more managed version of the Kubernetes service on one hand, and less opportunity to maneuver and play with settings on the other. Therefore we’ll go to the upper right corner of the screen and click SWITCH TO STANDARD CLUSTER. In the window that pops up click again.
Now a multi-step settings page opens. Note that on the side there is a menu with ten steps. Let’s begin.
Cluster basics:
-
Name - apps
-
Location - Regional, me-west1.
There’s nothing more to configure there. Continue to another step. Do not click CREATE!
default-pool:
-
Size - change to one machine per zone. We’ll change more later. The goal is as few machines as possible running for nothing.
-
Below mark Enable cluster autoscaler.
-
As a result, change the Size limits type slightly below to Total limits.
Continue to the next step.
Nodes:
Scroll down a bit and then choose a machine of type e2-standard-4. This machine is large enough to run a Control-Plan (which is the cluster’s management system) and a few small containers. And only if the load grows, the cluster will deploy additional machines.
Networking:
Under Maximum Pods per node mark 32. A machine of this size cannot run such a number of Pods so there’s no point in wasting more addresses.
Security:
-
Choose the service account we created earlier for the cluster.
-
Mark Enable secure boot.
Continue to CLUSTER.
Automation:
-
Under Maintenance Policy mark Enable Maintenance Window.
-
Set it to two days a week with a six-hour maintenance window. Say - Friday and Saturday between midnight and 6 AM. That means choosing 12AM as the start time, and marking a duration of 6 hours.
Networking:
-
In Network choose the app network we created earlier.
-
Node subnet is main - the primary Subnet we created for that network.
-
Under IPV4 network access, mark Private Cluster.
-
Cancel the mark on Access control plane using its external IP address.
-
Give a small range with prefix 28 for Control Plan addresses. These are the cluster’s management tools, and they don’t need much. Therefore a range like 172.16.1.0/28 should suffice.
-
Cancel the mark on Automatically create secondary ranges.
-
For the secondary range for Pods choose the pods subnet we created earlier.
-
Mark a maximum of 32 Pods per machine.
-
For the secondary range for Services choose the services subnet we created earlier.
-
Mark Enable Dataplane V2.
-
Under Authorized networks click ADD AN AUTHORIZED NETWORK. There choose the address ranges from which it’s possible to connect to manage the cluster with the Kubectl tool.
-
Give the range the name App and give it the range 10.0.1.0/24, which is the range of the main Subnet in the network where the cluster resides.
-
It’s always preferable to manage the cluster in a completely private and internal manner. If there’s a service we want to expose to the world, that can be done through a Load Balancer with an external address. It’s also preferable to put Cloud Armor on it which provides network protections and a kind of WAF. Later we’ll learn more complex and protected ways to publish services.
-
It’s advisable to restrict access to cluster management as much as possible. Later we’ll see more ways to do this.
Security:
Pay attention to the options here. Currently don’t mark anything that isn’t marked, later we’ll edit the cluster and add options.
Click CREATE.
Now a process will run behind the scenes that will build the cluster according to the settings we entered. This can take 5-20 minutes. Already with the process we go to the Clusters page and see our first cluster in the list, being created.
After the process finishes, the cluster in the list receives a green mark and we can start working.
Auto Scaling:
One of the principles behind container services is to consume the resources being used, and not much more than that. To utilize this feature, the Auto Scale needs to be configured correctly. Thus each application/service or the number of machines in the cluster will grow and shrink according to workload, and you pay only for what’s consumed.
-
Click on the cluster name in the Clusters page to enter its settings.
-
We’ll see at the top that there are several tabs. We want to switch to Nodes.
-
Anyone who waits a few minutes after the cluster is created will see that currently only one machine is running. The cluster saw there was no load, and shut down two of the three machines set up with the cluster.
-
Click on default-pool under node Pools.
-
Here we see all the settings related to machines. What size they are, what their service account is, how many machines in total in the cluster, and how many per zone, etc.
-
Pay attention to the Size settings. We already configured all of these at setup time. But anyone who populates their cluster with applications will see later that consumption grows as usage increases, and then the cluster will deploy three machines, and suddenly more is needed. It’s worth keeping a finger on the pulse and allowing in the Maximum number of all nodes setting a safety margin that allows the cluster to grow beyond its normal consumption.
-
On the other hand, you need to be careful not to allow a maximum of 100 machines now, trusting that the Auto Scaler will keep you to one machine. Almost always that is indeed what will happen. But there have been cases of a fault or attack that caused a service to consume more and more and more resources, and in that case the cluster will grow and expand up to the limit allowed. And you pay for every machine. So allow it room to grow within reasonable limits, and no more.
-
Click CANCEL at the bottom and exit the edit page.
Deploying an Application on the Cluster:
-
In the Kubernetes Engine menu on the left click on Workloads.
-
On the page that opens, click CREATE DEPLOYMENT and go to the page where the application is configured.
-
We’ll see that there’s a card where the container is defined. Currently it’s pointing to an Nginx Image with the latest version tag. We’ll delete that and paste there the string with the container address and the latest tag:
me-west1-docker.pkg.dev/mobile-app-yosi/breakbricks/breakbricks:latest-
Click CONTINUE.
-
Currently configuring a Deployment, which is the name for the settings package under which the application runs.
-
Give the name - breakbricks.
-
Namespace divides into categories everything running on the cluster. This allows separating or centralizing the association of service accounts, storage means, environment variables, and more. Give it the namespace - breakbricks.
-
Labels can help later when sorting services and resources by tags. Currently it’s not that interesting. You can delete them, but we’ll just change the label from nginx-1 to breakbricks.
-
Below that there’s a VIEW YAML button. Click it and observe. This is how a deployment’s settings look. Later we’ll see how to work with this. Close the YAML and click CONTINUE.
-
Mark the Expose deployment as a new service box.
-
Immediately more options will open to configure. There’s no need to change anything, since we’ll access the service on port 80, and the container also accepts port 80. If the container were accepting a different port from the port we’re accessing from outside, a Target port would also need to be specified. Also the service publishing is as a Load Balancer. It needs to externalize an address we can access from outside the cluster to reach the application.
-
Click DEPLOY.
And here the Deployment page has opened for us. The package was deployed in three Pods, and at the bottom we see the external address of that LB we defined in Expose.
If we click on the address there or enter the address in the browser with the http protocol, we’ll get access to our BreakBricks game - this time from GKE.
Autoscale:
The difference between Horizontal and Vertical in the context of Autoscaling is one of allocation growth (or reduction). Vertical growth refers to the amount of resources allocated to the same unit. If the unit is a VM or Container. Horizontal growth refers to the number of units deployed in the same group to meet the service demand.
There are cases where vertical growth is required, but in most cases today horizontal growth is preferred. Horizontal growth creates better load distribution, a distributed mechanism resilient to failures. Because if one part fails, there are several more available to provide service until the failure is fixed.
All this is especially true for container-based technology. A container is designed to be a small and compact unit, and if it exhausts its computing capabilities, another container is raised. If there’s a failure in one unit, another container comes up quickly and the failed one shuts down.
At the top of the page click:
ACTIONS >> Autoscale >> Horizontal pod autoscaling.
We’ll see that our application is configured with a range of 1-5 copies. We’ll also see that we have a metric set for the number of copies running - if the existing copy reaches 80% CPU, the cluster will deploy another copy.
You can close.
Look at the page and see the CPU consumption gauge in the dashboard. Currently the consumption is negligible. But if we look further down, we’ll see that 3 copies are still running in parallel.
Why?
There’s another place where Horizontal pod autoscaling can be configured, and that’s in the rows between the resource consumption panels and the list of running copies. We’ll see there’s a Horizontal pod autoscaling row, and on the right there’s a pencil for editing. And we’ll notice something else - next to the Horizontal pod autoscaling heading there’s an orange warning mark - the cluster can’t parse the Autoscaling definition based on processing resource consumption.
To understand why, let’s go to the most important part of running a Kubernetes system, and that’s YAML files.
YAML Manifests:
The resources in a Kubernetes cluster are defined using YAML files that contain certain fields. Writing the details in the correct format and uploading to the cluster will update the system about what we want to run, how, in how many copies, etc.
Still on the same page, note that near the top of the page there’s a row of tabs, with us on the OVERVIEW tab. Let’s switch to the YAML tab.
All these sections we see contain settings or options in the application’s deployment. No need to be alarmed by the mess, the more we work with Kubernetes the more familiar we’ll become with the sections, and the mess will turn into something familiar where we know where to put and find everything.
Like any YAML file, there is a graduated hierarchy here by categories and subsections. If we scroll down to the bottom we’ll see that the last category is the deployment’s status, and above it a spec category. Spec is a name that appears a lot as a general heading for a group of settings (specification) of components.
You can see that within the spec category there’s another subcategory with the same name. There is the definition of the container placed in the Pod. And there is the resources definition, and it’s empty.
As long as we haven’t defined how many resources to allocate to each container, the Autoscaler won’t know when consumption is above or below 80%, and won’t know what to do. And therefore it went with the average number between 1 and 5 and deployed three copies.
Therefore we’ll click EDIT at the top of the page, delete the curly braces of resources and change the value to look like the screenshot, and click SAVE.
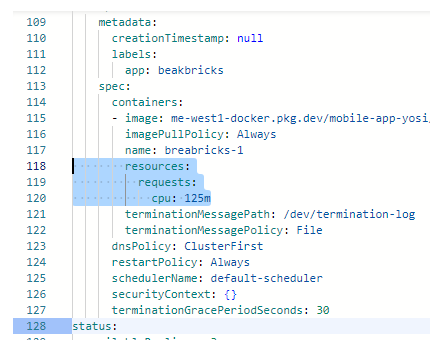 YAML Manifest
Go back to the OVERVIEW page and maybe refresh it, but very quickly we’ll see that the number of copies has shrunk and now only one Pod is running. You can also see that the warning sign next to Horizontal pod autoscaling has turned into a green status mark.
Kubectl:
Until now we’ve created and managed the cluster entirely from the management dashboard. An important part of knowledge is knowing how to operate the command line. As always, there are many things that can be done better, or only through the command line.
This Kubernetes management tool is called kubectl. Now we’ll install it and learn to get acquainted with working with it.
- It should be remembered that in principle it’s possible to work with Kubectl from Cloud Shell, but because we restricted access to Control Plan, we’ll activate it from a server on the same network we defined as the Authorized Network.
Preparation:
Still on the Kubernetes Engine page, in the side menu click on Clusters, and there enter our cluster - app.
At the top of the page click CONNECT, copy the command that appears there and paste it aside.
Go to IAM & ADMIN >> Service Accounts and set up a service account named kub-mgmt, giving it the following permissions:
-
Compute Viewer
-
Kubernetes Engine Service Agent
Then go to Compute Engine and create a micro-size Ubuntu server for us. Call it kub-managment and place it in the Israel Region. Connect it to the app network in the main Subnet, and give it the address 10.0.1.50 and don’t touch the external address setting. We’ll need it for a few installations, and after that we’ll remove it.
Attach the service account we just created to the server.
-
Sometimes it takes time for the system to update with the new account details. So if it doesn’t yet appear in the list of available service accounts for the server, wait a bit and open the page a little later and try again.
-
Before connecting via SSH to that server, make sure a firewall rule was opened to allow traffic from the address range 35.235.240.0/20, as we learned in the first labs.
Connect via SSH and check our status with the command:
gcloud components listThe tools we need are kubectl and also gke-gcloud-auth-plugin and these are not installed by default.
While everything works as it should, the command
gcloud components install kubectl should install the tool, but at the time of writing these lines it simply doesn’t work, and you need to reinstall the entire gcloud package, and then separately the two other packages.
So until this is fixed, we’ll reinstall the tools.
Installation Commands:
# gcloud

sudo apt-get update

sudo apt-get install apt-transport-https ca-certificates gnupg curl sudo -y

curl https://packages.cloud.google.com/apt/doc/apt-key.gpg | sudo gpg --dearmor -o /usr/share/keyrings/cloud.google.gpg

echo "deb [signed-by=/usr/share/keyrings/cloud.google.gpg] https://packages.cloud.google.com/apt cloud-sdk main" | sudo tee -a /etc/apt/sources.list.d/google-cloud-sdk.list

sudo apt-get update && sudo apt-get install google-cloud-cli -y

# kubctl & gke-gcloud-auth-plugin

sudo apt install kubectl -y

sudo apt install google-cloud-cli-gke-gcloud-auth-plugin -y
And after everything is installed, we can remove the external address from the server and connect to the GKE cluster.
Working with the Command Line:
First, we need to define which cluster we’re working against, and where kubectl commands we execute are sent. Therefore we need to paste the command we copied earlier from the cluster’s CONNECT page. In my case it looks like this:
gcloud container clusters get-credentials app --region me-west1 --project mobile-app-yosiAnd now we can work.
kubectl commands work in a familiar format and you can apply principles known from working with docker or other things. The structure is:
Kubectl
So for example, after kubectl which calls the tool, you can place commands like get, describe, create, delete, etc.
The resource on which the command applies can be deployment, pod, service, namespace, serviceaccount, etc.
Basic Commands:
Let’s throw a few commands to get information about what we have in the cluster right now:
kubectl get namespaces - We’ll get a list of the namespaces we have in the cluster. We’ll see default, some that the Control-Plan uses, and breakbricks that we created and deployed our game in.
kubectl describe namespace breakbricks- We’ll see that there’s one pod and one service running there.
kubectl get pods --namespace breakbricks- Will show us the running Pods. From there we can take the name of the running pod, and run commands on it like describe to get information, delete to delete, connect to it, and more.
kubectl logs breakbricks-6759c5bf8-x4jgv --namespace breakbricks- I took the pod name from the previous command, and used it to run a command that displays its logs on screen.
Updating Settings:
Until now we used read-only commands. Now we’ll learn how to update settings and create features in the cluster using kubectl.
First, before any editing, a good and careful step is to go over the item’s details again:
kubectl get deployments --namespace breakbricks
kubectl describe deployment -n breakbricks
And then a look at the deployment’s YAML:
kubectl get deployment breakbricks -n breakbricks -o yamlEarlier we saw how to update settings directly through the management dashboard, or through YAML in the management dashboard.
Through kubectl we can change properties directly, such as the kubectl set command that can set a small number of settings (you can enter kubectl set -h to see which settings), or commands designed to change a single property. Like kubectl scale which sets a fixed number of copies, or kubectl autoscale which sets a range, and a metric by which the number of copies is determined across the range. For example:
kubectl scale deployment/breakbricks --replicas=10
kubectl autoscale scale deployment/breakbricks --min=1 --max=5 --cpu-percent=80
But the most advanced way that gives access to editing all options is YAML editing.
For this you can use the kubectl edit command, and edit the YAML through the server’s text editor. Anyone who doesn’t like using vi and prefers nano, will first set the local variable:
export KUBE_EDITOR=nanoAnd then:
kubectl edit deployment breakbricks -n breakbricksScroll down to the container name, and change it from breakbrick-1 to test. Exit and save like any nano save. If we were careful to maintain the correct YAML format and enter valid values, we’ll receive a message that the deployment was edited.
Check:
kubectl get pods -n breakbricks- Gives me a pod name. And then:
kubectl describe pod breakbricks-59bffc84bd-mtq4j -n breakbricks- And here I look under Containers and see that the test container is there.
This way all desired settings can be edited.
Creation Using YAML:
Using YAML and the kubectl apply command you can edit settings or create new items.
All that’s needed is to point to a YAML file, and then execute a similar command:
kubectl apply -f Config-File.yamlNote that in every such YAML there’s a section at the top of the file that says what type of item this is - of type deployment, pod, or service.
In the case where the settings point to an existing item - for example: the file says these are deployment-type settings, and the sections that determine the deployment name and namespace match a deployment that already exists in that namespace, what will happen is that deployment will be updated to operate according to the new settings.
If such an item doesn’t yet exist, the cluster will create it exactly according to the settings in the file. Of course, assuming the format and values in the file were written correctly.