Connecting Application Integration to the Internal Network with a Central HTTP Connector
A guide for connecting Application Integration to the internal network using a single HTTP Connector for multiple destinations. The solution is designed to save Connector costs.
Introduction:
Connecting Application Integration to various services on the internal network can be a very expensive proposition. The connection is made through a Connector, which is a component with a significant cost. That cost can justify itself in certain usage patterns, and only at high traffic volumes.
Each Connector operates behind the scenes on a server cluster, while connecting to a single destination. To justify the cost of running that cluster, you need to make good use of its traffic capacity. If you don’t, the servers run idle and cost money for as long as they exist.
The problem is compounded when there are multiple destinations, and the traffic volume at each individual destination does not justify the cost of a separate Connector.
This guide demonstrates a solution for using a single HTTP Connector connection for multiple destinations. This allows better utilization of the Connector, and enables operation even at lower traffic volumes.
In this lab you can gain knowledge and practice the following topics:
-
Compute Engine Instance Groups.
-
Cloud Load Balancer
-
Nginx LB.
-
Private Service Connect & Endpoint Attachment.
-
Cloud DNS.
-
Application Integration.
-
Integration Connector.
Overview of Application Integration, the Problem, and the Solution:
Application Integration:
Application Integration is a Google Cloud (GCP) service designed to connect and bridge between different services.
The service operates in a No-Code - Low-Code model, allowing you to create action flows based on logic. The actions are various components that can be placed on a canvas in a specific order, with each component configured for its behavior - all without writing code. There are still components where you can run code if you want, which expands the range of possibilities.
In short, it is a Drag & Drop approach.
Component types range from process triggers, sending REST requests, placing/setting variables, components that determine logic in the process, and components that communicate with defined systems such as SalesForce, Monday, or other Google Cloud services.
This is a managed service where the user/administrator does not see servers and does not deal with installations.
The service lives within GCP’s managed systems, and is linked in various ways to the project we manage. This explains the connectivity configuration between the Application Integration service and other components and services that live within our project.
Connectors:
Among all the component types mentioned, these are designed to provide quick connection configuration - to a specific service, an external system, or a private service sitting on the internal network.
Each such Connector operates behind the scenes through a server cluster. The cluster runs software that links and translates between the component we define in Application Integration and the destination that Connector represents.
The cluster grows and shrinks based on the load on it. Part of the Connector configuration is the minimum and maximum number of servers that will run in the cluster - Auto-Scaling.
Therefore a Connector can be an expensive undertaking that pays off only from a certain volume of work. Each server in a Connector costs X amount and is capable of serving 100 concurrent requests. If we maintain a Connector that most of the time serves a handful of requests, we are paying a lot for an expensive product without getting the value. Given that each Connector has a single defined destination, we could find ourselves bearing the costs of several server clusters, each serving a single purpose that does not necessarily justify the expense.
Working Against the Internal Network:
Application Integration is a managed service, as mentioned. Therefore it does not operate within the organization’s internal network environment. To make requests from within an Integration process to services living on the internal network, you need to create Endpoint connectivity between the internal network and Application Integration.
In this article I want to present two approaches in which a single Connector can be used to reach any HTTP service on the internal network from within Application Integration. The central idea is to send all HTTP requests to one Connector that reaches the internal network. Within the internal network, requests are routed to the different destinations based on the Hostname in the request. This solution allows consolidating few requests from each process, collectively reaching a request volume that justifies the cost of a Connector.
First Configuration - ALB:
 HTTP Connector - ALB
This configuration is lighter to set up on one hand, but limited to destinations within a single project on the other.
In this configuration, requests arrive from the Connector to an Application Load Balancer on our internal network. An Application Load Balancer can forward different requests to different destinations based on request attributes.
This approach is simpler and cheaper. However, it is only suitable for cases where all the destinations you want to reach through the Connector are concentrated in a single project, since an ALB does not on its own route to servers sitting in networks in other projects.
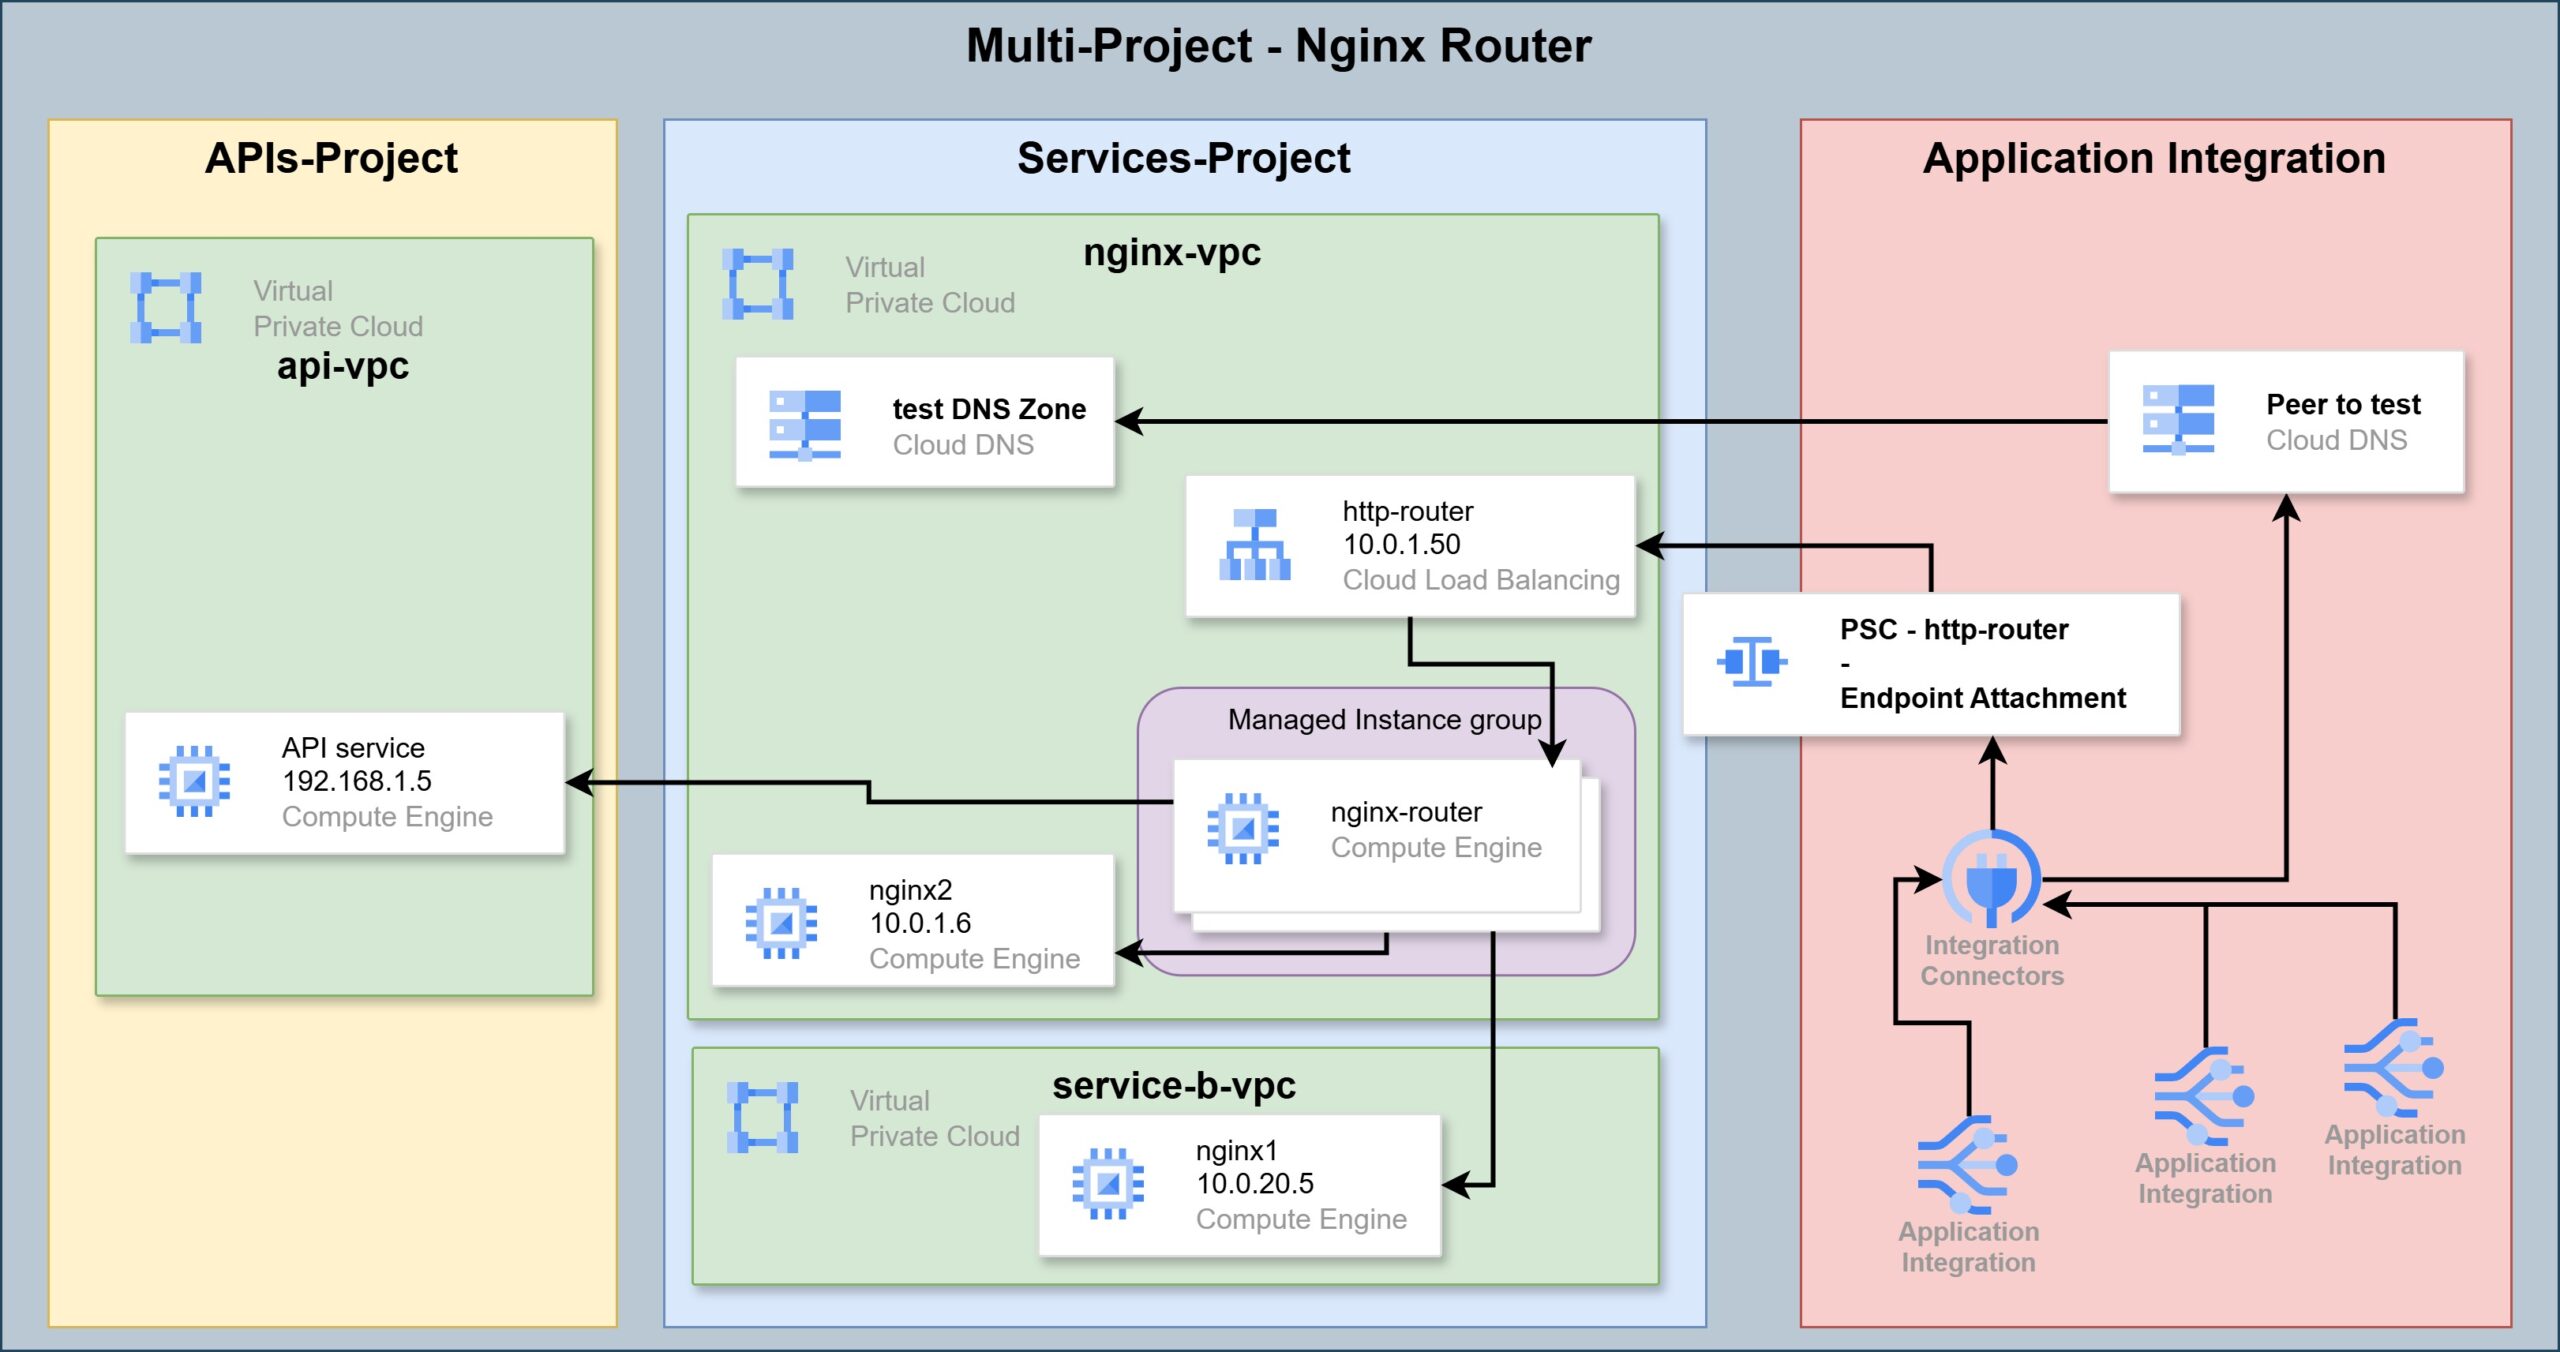
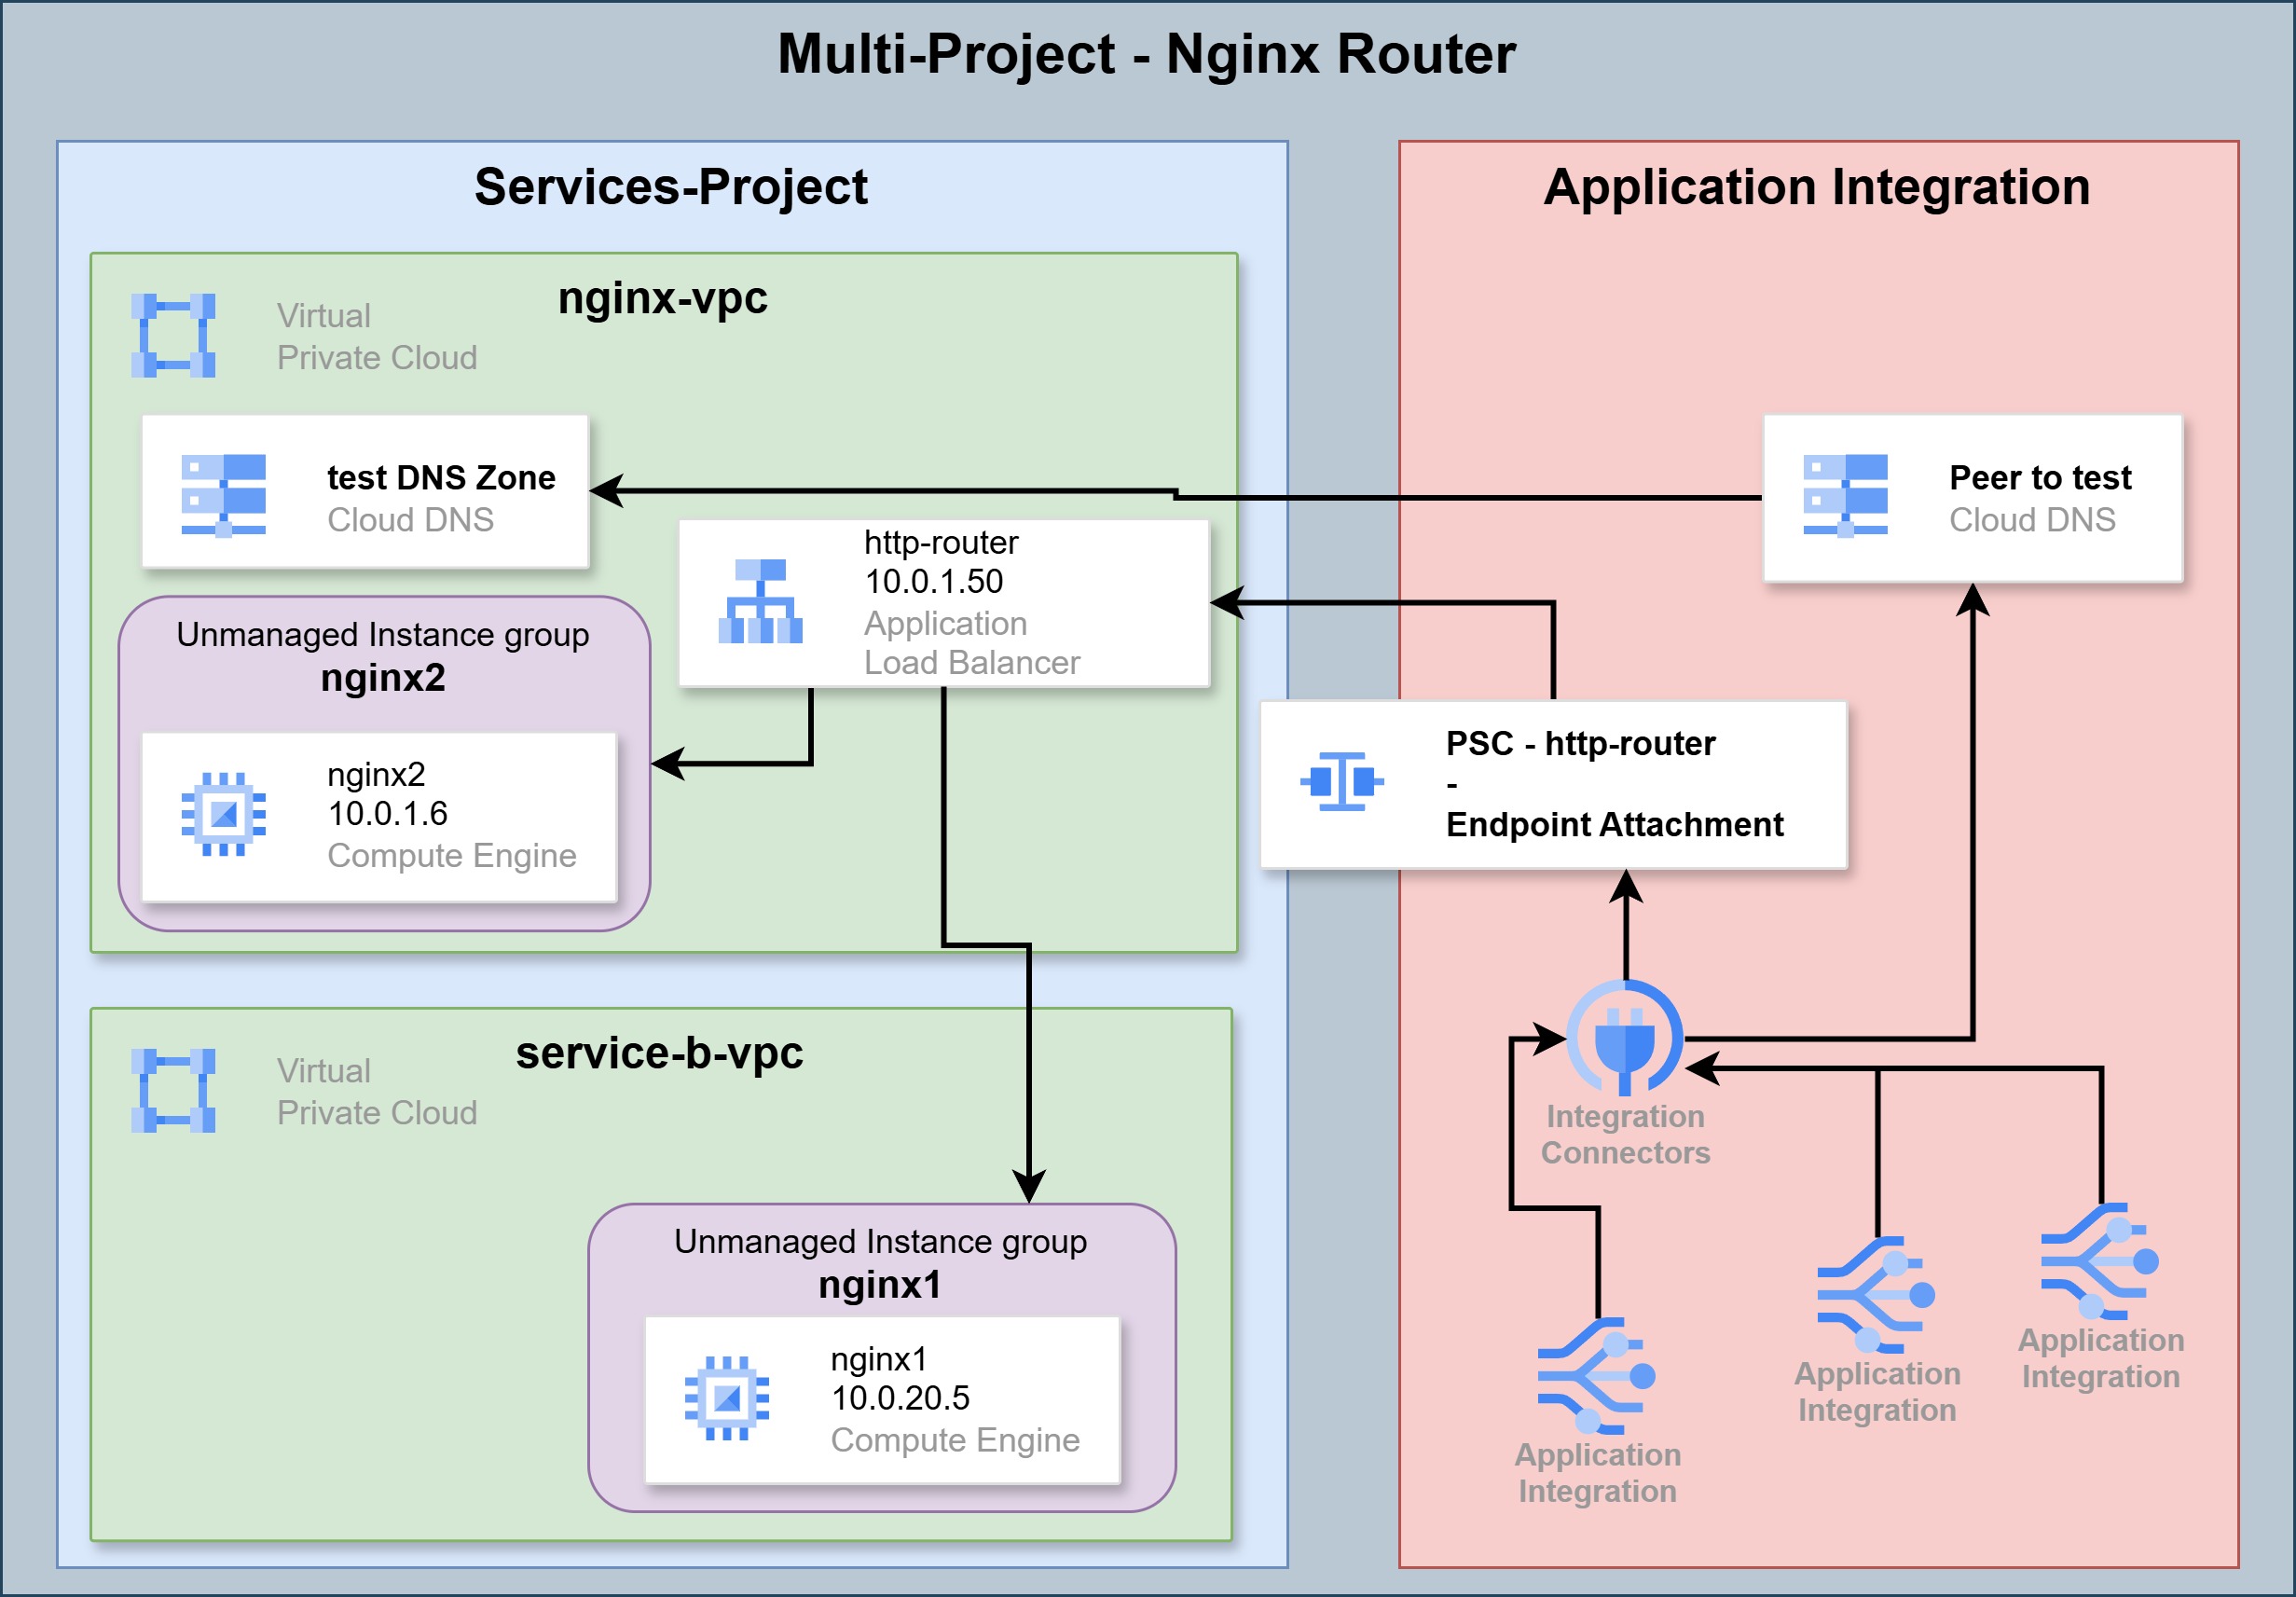
Second Configuration - Nginx Router:
HTTP Connector - Nginx Router
This configuration is somewhat more complex to set up, and also costs more. The advantage over the previous method is broader coverage for the destinations to which requests can be routed from the Connector.
In this configuration, requests arrive from the Connector to a Network Load Balancer on our internal network. Behind that NLB you can place an Nginx server, which receives the requests and forwards them to different destinations based on the Hostname in the request.
The advantage of this configuration is that the same Nginx server can be allowed to route requests also to servers/services located in other projects. This can be enabled through VPC Peering, Hub & Spoke, and more.
Auto Scaling:
Since this configuration requires placing a server for the routing, you need to account for fluctuations in traffic volume. This configuration is intended from the start to serve broader coverage for a variety of destinations that will receive requests from the Connector. So sometimes the proxy server (the Nginx) will need to handle a load of requests, and sometimes it will not fully utilize its resources.
Auto Scaling gives us the ability to allocate resources only when needed, and at other times to pay for minimum resources. This is achieved through a Managed Instance Group. This group can increase the number of Nginx servers under heavy load, and reduce the number when the load drops.
Building the Setup:
Before You Begin - Important Notes:
This guide covers the setup and configuration of various components in the cloud environment. Various topics that come up in the guide and are not explained in full detail appear in earlier guides published on this site.
For background knowledge and additional instructions:
- Setting up projects, networks, firewall rules, and creating servers - GCP Cloud Labs - First Lab.
- Permissions and service accounts - GCP Cloud Labs - Third Lab.
- Connections between different networks in different projects, Hub & Spoke, and routing - GCP Cloud Labs - Fourth Lab.
Setting Up HTTP Services:
To demonstrate consuming two different HTTP services from the same Connector, we first need to create two different services on the internal network. We will do this in a simple way using two Nginx servers.
Setting Up Nginx Servers:
First, verify that Firewall rules allow access to machines on the network on port 80 only from the internal network, and on port 22 only from the internal network or from Identity Access Proxy (as mentioned, instructions are in the lab I wrote).
Second, create three e2-micro machines with Ubuntu OS and place them on the same network.
- In the ALB configuration there is no need for a third nginx-router machine.
You can name them nginx1, nginx2, and nginx-router. I am assigning them the addresses 10.0.1.5, 10.0.1.6, and 10.0.1.45. They need to be given external addresses, unless you want to set up a Gateway machine or NAT Gateway service for the lab.
Finally, you can install an Nginx server on each of the machines.
First switch to using the root user:
sudo -iThen install:
apt update
apt install nginx -y
Customizing the Nginx Servers:
Now we want to customize the nginx service on each of the servers, to perform a different action in order to serve the setup.
On the nginx1 and nginx2 servers, edit the default page that the server displays. Delete all the content of the page and replace it with the server name.
For example, start with the nginx1 server. First delete all the content of the nginx default page:
truncate -s 0 /var/www/html/index.nginx-debian.htmlThe following command will open the file for editing:
nano /var/www/html/index.nginx-debian.htmlThere write “nginx1”, then close and save with ctrl + X, then y and Enter to confirm.
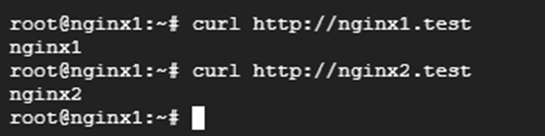
After configuring both servers to return a simple response containing the server name, try calling them and see what comes back.
From the nginx1 server, make the following call to the nginx2 server:
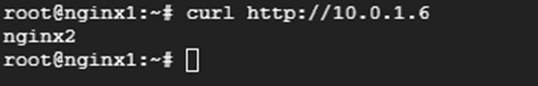 Call to Nginx2 service
From the nginx2 server, make the following call to the nginx1 server:
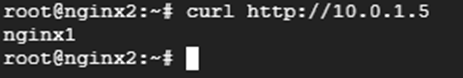 Call to Nginx1 service
Each server responds with its own name, as we configured.
Different Configurations:
This section of the guide is divided into two parts. In each part we will implement one of the two solution configurations presented above.
NGINX Router Solution:
In the case where you choose a single connection for all projects and environments, we will use an Nginx server as an HTTP proxy and router to forward requests from the connection to the rest of the network.
HTTP Router:
Now go to the nginx-router server and edit its configuration, so that it directs traffic to the appropriate server based on Hostname. To do this you need to configure DNS, or a Hosts file. At this stage we configure only a Hosts file:
nano /etc/hostsAnd there add the following records:
10.0.1.5 nginx1.test
10.0.1.6 nginx2.test
Close and save.
Now add the routing rules to the nginx configuration.
First the command:
nano /etc/nginx/nginx.confAnd there in the http section add a block for each destination:
        server {
            listen 80;
            server_name nginx1.test;

            location / {
                proxy_pass http://nginx1.test;
            }
        }

        server {
            listen 80;
            server_name nginx2.test;

            location / {
                proxy_pass http://nginx2.test;
            }
        }
Close and save, then enter the following command:
systemctl restart nginxFor each destination you want to route to through the nginx http router, you will need to add a server block like this. The first part sets the routing condition - which port to listen on, and what hostname must be in the request to forward to that specific destination.
The second part sets the destination - where to forward the request if it was received on the correct port with the correct server name.
Now check that the router is working. Open the hosts file on the nginx1 server:
nano /etc/hostsAnd there add the following records to route all requests through the nginx-router server:
10.0.1.45 nginx1.test
10.0.1.45 nginx2.test
Close and save.
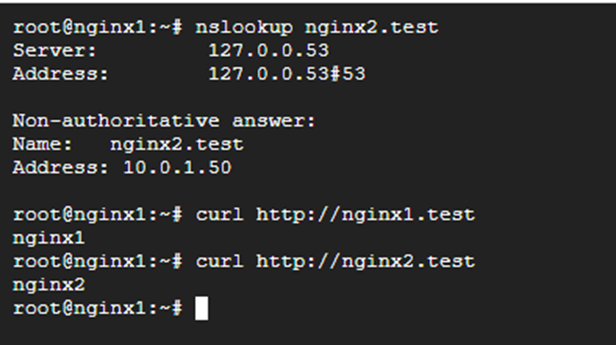
Testing:
Still on the nginx1 server, send requests to verify the routing works:
 HTTP Router Test
Now we have a central point that receives HTTP requests and forwards them to the destination based on the server name.
Instance Group:
A Load Balancer in GCP can manage traffic to all kinds of destinations. Certain destinations can serve as direct targets for LB traffic, such as a storage bucket or a Cloud Run service. Virtual machines cannot be direct targets. Services like Cloud Run or Cloud Storage Bucket are completely Serverless. The Auto Scaling capability exists inherently in the way the service is exposed. A virtual machine on its own does not have this mechanism, so before connecting it to an LB you need to place it in an Instance Group.
Under an Instance Group you can place one or more machines, and configure Auto Scaling or not.
All of this is important to understand. Anyone implementing the solution in this lab in a real environment will most likely need an Auto Scaling mechanism. This can be achieved by creating an Image from the nginx-router machine, and from that creating a Managed Instance Group that grows and shrinks based on traffic volume.
Creating an Image:
- In the hamburger menu go to Compute Engine and then to VM instances.
- Click the three dots on the nginx-router row and in the popup menu click Stop. Wait for the machine to shut down.
- Still in the Compute Engine menu, click on Disks.
- There on the nginx-router row click the three dots, and in the popup menu click Create image.
- On the page that opens, give it the name - nginx-router.
- For location, select Regional - in Tel Aviv of course.
- Click CREATE at the bottom.
Building an Instance Template:
- Still in Compute Engine, go to Instance templates.
- Click CREATE INSTANCE TEMPLATE.
- Give it the name - nginx-router.
- For location, select Regional again - Tel Aviv.
- Select a machine size based on the minimum traffic volume you expect. In our case we can start with e2-micro. You can always change the machine size in the template.
- Under Boot disk, click CHANGE to select the Image we created in the previous step.
- A panel opens and there you will find yourself on the PUBLIC IMAGES tab. Switch to CUSTOM IMAGES and there select nginx-router. Then click SELECT.
- Select the correct network for placing machines from this Template, without external addresses.
- Click CREATE.
Deploying the Managed Instance Group:
- Still under Compute Engine, go to Instance groups.
- Click CREATE INSTANCE GROUP.
- Give it the name nginx-router.
- Select the template we created in the previous step.
- Scroll down a bit. Under Location select Multiple zones, then Even as the distribution method.
- Verify in the Autoscaling settings that automatic addition and removal of machines from the group is enabled, and that the minimum number of machines in the group is 1 and the maximum is 5.
- Under Autoscaling signals configure the signals by which the group knows to add or remove servers. For now keep it simple and select CPU utilization as the metric, and set it at 80% consumption.
- Under Autohealing click on the Health check field and there click CREATE A HEALTH CHECK.
- In the panel that opens on the right, give it the name nginx-0.
- Scope - regional - Tel Aviv.
- For the lab there is nothing to change here. In a production environment you might want to change the time between checks, or the number of signals that determine failure or success. For now this is enough, so click SAVE.
- For everything else there is nothing to change, so scroll to the bottom and click CREATE.
Creating a Network Load Balancer:
- In the search bar at the top type Load Balancing, or in the hamburger menu search for Network Services and go to Load balancing.
- Click + CREATE LOAD BALANCER.
- Select Network Load Balancer. Click NEXT.
- Select Passthrough load balancer. Click NEXT.
- Select Internal. Click NEXT.
- Click CONFIGURE.
- Give it the name nginx-router, select the Tel Aviv region, and select the network where it will be placed.
- In the Backend settings select the Instance Group we created - nginx-router, and the Health check we created - nginx-80.
- Under Session affinity you can select none if it has no significance. But if there are requests to services that need it, it is worth selecting Client IP, port and protocol.
- Go to the Frontend settings and give it the name nginx-router.
- Select the network where we want to place the LB.
- Select an IP address of type Ephemeral (custom). Assign the address 10.0.1.50.
- Mark the address as using all ports.
- Click CREATE.
That completes the creation of the HTTP Router based on the Nginx server.
ALB-Based Solution:
A quicker and easier configuration to set up would be placing GCP’s Application Load Balancer. As mentioned, this solution is only suitable when all requests passing through the connection need to reach the same project.
Instance Groups:
In the Nginx Router configuration we saw how to create a managed group of servers. Here we will create groups that we define and manage ourselves.
One characteristic of an Unmanaged Instance Group is that the group lives in a single Zone. Therefore to ensure service availability, you can create one server in each Zone. Then create a group for Zone A and another for Zone B, and the LB will manage traffic to them.
For now availability doesn’t concern us. What we are interested in is ensuring traffic distribution to destinations based on Hostname. In our lab there are two services. One service returns “nginx1”, the other returns “nginx2”. So we will put the servers of each service into its own group.
Creating an Unmanaged Instance Group:
- In the GCP hamburger menu, go to Compute Engine.
- There go to Instance groups.
- Click CREATE INSTANCE GROUP.
- On the page that opens, click on New unmanaged instance group on the left.
- Give it the name nginx1.
- Select the Region and Zone where the nginx1 server is located.
- Select the network where the nginx1 server is located.
- Select the subnet where the nginx1 server is located.
- Now you can select a server from among the servers in that Zone and Subnet. Select nginx1.
- Click CREATE.
Repeat the process and create a similar group for nginx2.
Creating an ALB:
- In the GCP hamburger menu, go to Network Services.
- There go to Load balancing.
- Click on + CREATE LOAD BALANCER.
- Select Application Load Balancer. Click NEXT.
- Select Internal. Click NEXT.
- Select Best for regional workloads. Click NEXT.
- Click CONFIGURE.
The LB settings page will now open. There set its name - http-router, select the location - Tel Aviv region, and the network where it should sit.
When you select the network, you will need to configure a Proxy Subnet. Give it the name http-router-proxy and assign it a /24 range.
Backend Service:
- On the right side go to the Create or select backend service field, and click CREATE BACKEND SERVICE.
- In the panel that opens give it the name - nginx1.
- You need to select a target type. This can be a storage bucket, a Cloud Run service, or in our case - an Instance group.
- Select protocol and port. In the lab everything is simple - HTTP protocol on port 80.
- Under New backend click on the Instance group field and select nginx1.
- In the Port numbers field remember that the nginx1 service was configured to listen on port 80, so that is what we enter and press Enter.
- Since we have only one target, load balancing settings and such are not relevant.
- Scroll down further, and in the Health check field select the one we created earlier - nginx-80. If none exists, create one following the instructions that appeared above.
- Click CREATE.
Repeat the process and create another Backend for nginx2.
Routing Rules:
Now configure how the LB should route requests to each service, based on Hostname. Click on Routing rules on the left side, and there you can see two options:
- Simple rules that distribute traffic to the different services based on Hostname and Path.
- Complex services based on YAML where you can configure much more - such as adding and replacing parameters in the request. For example adding and replacing the Hostname before passing to the destination, changing the path, adding/removing/replacing Headers, and much more.
For now keep it simple and go with the basic rules.
You can see that by default it routes everything to nginx1. In a real environment you could route to an HTML page in a storage bucket as the default. For now, simply create two more rules.
Rule for nginx1:
In the host field put the name - nginx1.test. For path put Wildcard - /*. And in the Backend field select the nginx1 service.
Create a similar rule for nginx2:
In the host field put nginx2.test. For path the same Wildcard. And in the Backend field select nginx2.
Frontend:
Now configure the part of the LB that listens for requests.
- On the left side click on Frontend configuration.
- Give it the name - http-router.
- Use HTTP protocol.
- Select the Subnet where the LB’s address will be.
- Select the port on which requests to the LB can be sent. In our case that is 80. If there are additional services listening on other ports, you can enter a comma-separated list of ports. Note that once a Frontend is created it cannot be edited. If you want to add or change ports afterward, you will need to delete the Frontend and recreate it with the appropriate ports.
- In the IP address field select Ephemeral (Custom).
- Then set an IP address for it - 10.0.1.50.
- Click CREATE at the bottom of the LB creation page.
Testing:
Return to the terminal of nginx1, and there check the records in the hosts file. The records for nginx1.test and nginx2.test should point to the address of the LB - 10.0.1.50.
And this is what it should look like:
 ALB Test
That completes the ALB configuration.
Private Service Connect:
PSC is a configuration that allows creating a connection for a publishing service in one project, and then creating a client-connection in another project. This configuration enables private communication between two components/services in two different projects. The service that is connected as a client can talk only to the publishing component, and not to any other component in the same project or network. Similarly, other services in the client project cannot talk to the publishing component - only the component that was connected to it.
The setup requires publishing a Load Balancer as a PSC in the publishing project, and then creating a Service/Endpoint Attachment on the client side. Finally you return to the PSC settings and approve the connection from the client side.
Publishing the Service as PSC:
- Still under Network Services, go to Private Service Connect.
- Go to the PUBLISHED SERVICES tab.
- Click on + PUBLISH SERVICE.
- Under “Load Balanced Type” select the type of LB we created.
- In the Internal load balancer field select the LB we created.
- Give it the name http-router.
- Under Subnets you need to select an address range that GCP’s network infrastructure uses to place proxy addresses for the LB. Since in our lab environment we have not yet created such a Subnet for the LB, click RESERVE NEW SUBNET.
- In the panel that opened give it the name http-router, and the range 10.0.2.0/24 and click ADD.
- Click ADD SERVICE at the bottom.
Now the service has been published and appears in the list. Enter its page and keep the tab open. We will need to return there shortly.
Creating an Endpoint Attachment:
-
Open a new GCP tab and in the search bar find Integration Connectors.
-
There go to Endpoint Attachments.
-
Click CREATE NEW ENDPOINT ATTACHMENT.
-
On the page that opens, give it the name - http-router.
-
Select the me-west1 region.
-
Return to the page of the service we published earlier - the PSC. The first row of data is Service Attachment. Copy the path from there, and paste it into the Service Attachment field on the Endpoint Attachment creation page.
-
Click CREATE.
After some time you will see that the Endpoint Attachment has been created and received an IP address on the Integration side, something like 10.208.0.2.
Now you need to return to the PSC page and approve the connection request.
-
Return to the page of that PSC. If needed refresh it, and see at the bottom under Connected Projects a connection in Pending status.
-
Click the three dots on the side, and in the popup menu click Accept Project. In the window that appears simply click Confirm. Only if a large number of simultaneous connections are expected do you need to increase the number there.
We saw now that even after publishing a service, not just anyone can connect to it. A client side can request to connect, and then approval is needed on the publishing side.
Now the connection is active from both directions.
DNS and Integration:
When creating a Connector that connects to the internal network as we configured, every request must arrive at the Endpoint Attachment address - in our case that is 10.208.0.2.
This would not be a problem if the connection were meant to link to a single simple target on the other side. But the whole idea of what we are doing here is to create a solution that can serve requests to many different targets. The routing to different targets is performed based on Hostname. In addition, there are services and setups that require receiving a Hostname in the HTTP Request. Therefore we must direct every request with a DNS name as the Hostname from the start.
For this purpose we need to configure DNS that will translate the names to the address of the Endpoint Attachment.
Since Application Integration does not reside in our network environment, applying DNS configuration happens in a somewhat roundabout way.
First, create a DNS zone in our project:
-
Under Network Services go to Cloud DNS.
-
Click CREATE ZONE.
-
Select Zone type - Private.
-
Give it a display name - test.
-
Give it a domain name - test.
-
Click ADD NETWORK and add the network where the LB is located.
-
Click CREATE.
The DNS Zone will be created immediately and you will be taken to its page. Now add a record to represent the connection point:
-
Click + ADD STANDARD.
-
Give DNS Name - http-router.
-
Below put the IP address of the connection point on the Integration side - 10.208.0.2.
-
Click CREATE.
Since we want to use the same connection point for all kinds of addresses, create a general CNAME:
-
Click + ADD STANDARD again.
-
In the Resource record type field, select CNAME.
-
Then in the DNS name field put an asterisk.
-
Below in the Canonical name field enter the value we are targeting - http-router.test.
-
Click CREATE.
DNS Peer:
After those DNS settings are created, we need to allow the Application Integration service to consume them. That service lives in a different environment, so we need to create a peer zone. But just as we needed PSC approval to connect to it with an Endpoint Attachment, we also need permission for the peer connection.
The permission is granted to the Connector’s service account. The dns peer permission. The permission is granted in the project where the DNS Zone being accessed resides. Therefore if the LB and that DNS Zone are in project A, and the Integration is in project B, the permissions are granted in project A.
The Connector’s service account is always created in a fixed pattern:
service-<
Make sure that same account still retains the Application Integration Service Agent permission.
Creating a DNS peer zone:
- On the Integration Connectors page, go to Managed Zones.
- Click Create Managed Zone.
- Give it a name - test.
- In the Target DNS Name field, give the name of that zone created under Network Services. In our case it is simply - test.
- In the Target Network field put the name of the network we linked to that DNS Zone.
- Click CREATE.
Now every request coming from the Application Integration side with the .test suffix will pass through that connection point.
Creating the HTTP Connector:
All the preparations made so far were for this HTTP Connector. The goal, as mentioned, is to use a single Connector for many purposes on the internal network.
- Still under Integration Connectors, go to Connections.
- Click + CREATE NEW.
- Select location - Tel Aviv region. Click NEXT.
- Select Connector type - in our case that is - Http.
- Give it the name - http-router.
- In the Service Account field you can configure a special service account to run this connection. All that is needed is the Compute Viewer permission. But in the lab environment there is no need to deal with this and we keep the default.
- Under Connection node settings select the Autoscaling settings for the server cluster that processes this connection configuration. This is where the big costs are, so you need to consider what the minimum you need is. We can definitely make do with a single server. So put 1 for both minimum and maximum. Click NEXT.
- Under Destination we select Destination Type. In our case we always select Endpoint Attachment. There select the Endpoint Attachment we created earlier. Click NEXT.
- For Authentication there are many and varied options. In most cases for this configuration we can use Service Account Authentication. This means every request comes with the identity and permissions of the service account configured earlier for the connection.
- After choosing to work with the identity of that service account living in the GCP environment, we need to select a Scope. This defines where that service account is allowed to authenticate itself and issue an Access Token when accessing through this connectivity. Here give a general Scope for the GCP cloud environment: https://www.googleapis.com/auth/cloud-platform
Paste this address into the Scope field.
- Click REVIEW.
- Click CREATE.
The creation process takes 15-25 minutes, and then the Connector should receive a green Active checkmark.
Using the Connector from within an Integration Process:
Now we build a simple Integration process. There we see how two different requests go to the same Connector - each time with a different Hostname, and receive different responses based on the request’s Hostname.
Creating an Integration:
- In the search bar at the top type Application Integration, and go there.
- There go to Integrations and click + CREATE INTEGRATION.
- Give it the name http-router-demo and click CREATE.
The Integration process editing page will now open.
Interface Overview:
The center part is the component canvas. You can add components there from the buttons at the top - TEMPLATES, TASKS, TRIGGERS. The components are placed in a logical order and connected to each other as needed.
On the left are variables that can be defined or added for the process.
On the right is the settings panel. Whenever you select any component - a component on the canvas or a variable in the variables column, you configure its properties in the right panel.
Typically an Integration process opens with a Trigger that activates it. This is the opening component. From there you add components as needed.
Our process will have only three components.
Placing Process Components:
- Click TRIGGERS at the top.
- It doesn’t really matter what we select now, since we don’t need a process that actually runs in response to a specific event. So select API and place it on the canvas.
- Then go to TASKS and there in the CONNECTORS tab you can search for HTTP. But in the lab environment you can see the Connector we just created at the top of the list. Select it and place it on the canvas.
- Then repeat the action and add the same component again.
You can see that a Trigger component that activates the process contains an anchor point at the bottom, from which you drag a line to the next component.
Connector components in the middle of the process contain anchor points at the top and bottom. This allows connecting them to components that come before and after them.
In our case there is no real process, and we are not actually collecting data from one source, processing it, and sending it to another. But to simulate the process we will draw the lines and create a three-step process.
Configuring the HTTP Connector Component:
An HTTP Connector component in an Integration process is designed to send an HTTP request to a specific destination. This can be a data request or a send. Either way, there is a variable that contains the format for sending the request, and another variable that captures the result.
Click on the first component, the one that comes after the Trigger. Then you will see its details appear in the settings panel on the right. You will see that in the Entity/Action field it says Configuration Pending. This is because we have not yet configured the component.
You will see that at the top it took its name from the Connector. Still, let’s add nginx1 to distinguish it from the second one. So the names of the two components will be as follows:
- http-router-nginx1
- http-router-nginx2
Then click the blue CONFIGURE CONNECTOR button.
You will immediately move to the editing page and see that there are three steps.
Select connection:
This step is read-only and there is nothing to do here. It is already configured from when we selected the Connector type, and all that remains is to click NEXT.
Type:
Here we choose whether we want to activate the Connector on Entities or Actions.
These options vary depending on the Connector type. Some connections only support Entities, some only Actions, and some support both.
For example - if we were setting up a connection to Active Directory or SalesForce, we could define Entities. Entities would present us with data components at the destination - such as users or a card representing another entity. Actions in contrast represents operations for us - such as updating a user, resetting a password, etc.
In our case we do not have Entities since we are not connecting to a predefined source. We have only one operation - sending an HTTP request.
So select Type Action. Click NEXT.
Set entities/actions:
Here we choose how to use the configuration we set up earlier.
As mentioned, in our connection type we don’t have many choices. We select the only available option - Http Request and click NEXT.
After a few seconds you get a blue checkmark indicating the configuration was accepted, and you can click DONE.
You can repeat this sequence of steps when configuring the second Connector.
Component and Variable Structure:
You can see on the left the variables column. There, for each Connector component configuration, two variables were created. One variable for configuring the request sending, and the second for receiving the response.
You can also see that each of these variables is represented by an icon with the letter J inside curly braces. This tells you that the variable contains a JSON value.
Variable Types:
Clicking on the arrow to the left of the ConnectorInputPayload of nginx1 will expand the Schema of that JSON. A JSON Schema tells us that the variable expects to receive a JSON with very specific fields, and each field is defined by what type it will be.
The types are represented as follows:
J - JSON
STR - String
INT - Integer
B - Boolean - true/false or alternatively - 1 or 0.
D - Double. This is a type of decimal number (slightly different from Float).
For each of these types, there is also a representation as an array of items of the same type. Such as an array of JSON objects, or an array of strings, etc.
When you click on the variable on the side or on one of its components, the settings panel for it will pop up, and there you will see the full configuration under JSON schema.
- Much detail is provided here about this matter. This is so we can easily understand how to use various variables and configurations we will receive later, and how to fill in input data for such components.
Configuring the HTTP Request:
So as we saw earlier, an HTTP request configuration is a single JSON containing several components. The JSON of the request needs to be constructed correctly for it to work.
We saw that the URL component in the request is a JSON and not a string. This is critical. Because in this configuration we place each part of the URL separately under its own field.
The Format:
Scheme - the communication protocol of the request. This can be http, https, or ftp, etc.
Netloc - this is the Hostname part. Can also be an IP.
Path - of course, the path within the server/service.
Params - this is a part that is almost never used today. In cases where you want to pass parameters with the URL, this is the part where it happens. In a full URL format, after the Path there is a ; followed by the parameters.
Query - intended to filter at the URL stage and find an item or filtered list of items from what is on the server at the path.
Fragment - directs to a very specific part of the response received at the end. Like a specific paragraph in an HTML page.
Example of a fairly complete request:
{
  "Url": {
    "scheme": "http",
    "netloc": "nginx1.test",
    "path": "/list-objects",
    "query": "id=A&sort=value",
    "fragment": "Paragraph2"
  },
  "Method": "GET",
  "Headers": {
	 "Content-Type": "application/html"
  }
}
Typically for POST requests we would also add a Body. But in our case we can use a much simpler request.
The request format we will use:
{
  "Url": {
    "scheme": "http",
    "netloc": "nginx1.test"
  },
  "Method": "GET"
}
Copy this JSON and paste it into the Default Value field of the connectionInputPayload variable of nginx1.
Also paste it into the nginx2 variable, just remember to update the number in the netloc.
Testing:
If we wait a few seconds for the changes we made to save, we can click TEST above the settings panel. A panel will open with some settings for the process run, and there click TEST INTEGRATION.
If everything is configured correctly, within a few seconds you will see a green checkmark at the top with the text - “Integration execution succeeded”.
Whether it succeeds or fails, you can examine the logs and see what we received.
Click VIEW LOGS at the bottom, which will take you to the Integration logs page. Click on the log in the list to open it, and expand the rows for nginx1 and nginx2.
If everything was configured correctly, in each of them you will see that the desired response was received. You can find it by expanding the row for that step in the process, in the ConnectorOutputPayload field, under ResponceBody.
You can also simply expand the Response Parameters row at the bottom. There among other things you will see the output variables that were defined when creating the Connector components in the process. Each one contains the response it received in turn.